PNC Bank 2013 Annual Report Download - page 241
Download and view the complete annual report
Please find page 241 of the 2013 PNC Bank annual report below. You can navigate through the pages in the report by either clicking on the pages listed below, or by using the keyword search tool below to find specific information within the annual report.-
 1
1 -
2
-
3
-
4
-
5
-
6
-
7
-
8
-
9
-
10
-
11
-
12
-
13
-
14
-
15
-
16
-
17
-
18
-
19
-
20
-
21
-
22
-
23
-
24
-
25
-
26
-
27
-
28
-
29
-
30
-
31
-
32
-
33
-
34
-
35
-
36
-
37
-
38
-
39
-
40
-
41
-
42
-
43
-
44
-
45
-
46
-
47
-
48
-
49
-
50
-
51
-
52
-
53
-
54
-
55
-
56
-
57
-
58
-
59
-
60
-
61
-
62
-
63
-
64
-
65
-
66
-
67
-
68
-
69
-
70
-
71
-
72
-
73
-
74
-
75
-
76
-
77
-
78
-
79
-
80
-
81
-
82
-
83
-
84
-
85
-
86
-
87
-
88
-
89
-
90
-
91
-
92
-
93
-
94
-
95
-
96
-
97
-
98
-
99
-
100
-
101
-
102
-
103
-
104
-
105
-
106
-
107
-
108
-
109
-
110
-
111
-
112
-
113
-
114
-
115
-
116
-
117
-
118
-
119
-
120
-
121
-
122
-
123
-
124
-
125
-
126
-
127
-
128
-
129
-
130
-
131
-
132
-
133
-
134
-
135
-
136
-
137
-
138
-
139
-
140
-
141
-
142
-
143
-
144
-
145
-
146
-
147
-
148
-
149
-
150
-
151
-
152
-
153
-
154
-
155
-
156
-
157
-
158
-
159
-
160
-
161
-
162
-
163
-
164
-
165
-
166
-
167
-
168
-
169
-
170
-
171
-
172
-
173
-
174
-
175
-
176
-
177
-
178
-
179
-
180
-
181
-
182
-
183
-
184
-
185
-
186
-
187
-
188
-
189
-
190
-
191
-
192
-
193
-
194
-
195
-
196
-
197
-
198
-
199
-
200
-
201
-
202
-
203
-
204
-
205
-
206
-
207
-
208
-
209
-
210
-
211
-
212
-
213
-
214
-
215
-
216
-
217
-
218
-
219
-
220
-
221
-
222
-
223
-
224
-
225
-
226
-
227
-
228
-
229
-
230
-
 231
231 -
 232
232 -
 233
233 -
 234
234 -
 235
235 -
 236
236 -
 237
237 -
 238
238 -
 239
239 -
 240
240 -
 241
241 -
 242
242 -
 243
243 -
 244
244 -
 245
245 -
 246
246 -
 247
247 -
 248
248 -
 249
249 -
 250
250 -
 251
251 -
252
-
253
-
254
-
255
-
256
-
257
-
258
-
259
-
260
-
261
-
262
-
263
-
264
-
265
-
266
 |
 |

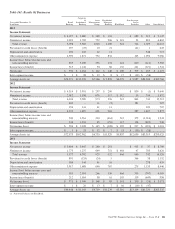
A
VERAGE
C
ONSOLIDATED
B
ALANCE
S
HEET AND
N
ET
I
NTEREST
A
NALYSIS
2013 2012 2011
Taxable-equivalent basis
Dollars in millions
Average
Balances
Interest
Income/
Expense
Average
Yields/
Rates
Average
Balances
Interest
Income/
Expense
Average
Yields/
Rates
Average
Balances
Interest
Income/
Expense
Average
Yields/
Rates
Assets
Interest-earning assets:
Investment securities
Securities available for sale
Residential mortgage-backed
Agency $ 23,869 $ 624 2.61% $ 26,522 $ 815 3.07% $ 25,892 $ 894 3.45%
Non-agency 5,828 317 5.44 6,506 350 5.38 7,413 394 5.31
Commercial mortgage-backed 4,105 160 3.90 3,682 156 4.24 3,461 158 4.57
Asset-backed 5,857 110 1.88 5,227 106 2.03 3,402 84 2.47
U.S. Treasury and government agencies 2,326 37 1.59 2,733 55 2.01 4,308 114 2.65
State and municipal 2,250 97 4.31 1,920 91 4.74 2,002 91 4.55
Other debt 2,632 64 2.43 3,019 82 2.72 3,350 87 2.60
Corporate stocks and other 342 350 428
Total securities available for sale 47,209 1,409 2.98 49,959 1,655 3.31 50,256 1,822 3.63
Securities held to maturity
Residential mortgage-backed 4,374 153 3.50 4,423 156 3.53 2,424 83 3.42
Commercial mortgage-backed 3,422 151 4.41 4,288 195 4.55 4,444 220 4.95
Asset-backed 983 16 1.63 892 17 1.91 1,985 43 2.17
U.S. Treasury and government agencies 235 9 3.83 226 9 3.98 87 3 3.45
State and municipal 749 42 5.61 670 28 4.18 271 12 4.43
Other 347 11 3.17 358 10 2.79 221 7 3.17
Total securities held to maturity 10,110 382 3.78 10,857 415 3.82 9,432 368 3.90
Total investment securities 57,319 1,791 3.12 60,816 2,070 3.40 59,688 2,190 3.67
Loans
Commercial 86,047 3,243 3.77 76,654 3,447 4.50 59,437 2,924 4.92
Commercial real estate 19,469 937 4.81 18,115 1,005 5.55 16,767 879 5.24
Equipment lease financing 7,329 292 3.98 6,674 307 4.60 6,219 309 4.97
Consumer 62,125 2,744 4.42 59,752 2,801 4.69 54,669 2,673 4.89
Residential real estate 15,003 773 5.15 15,423 832 5.39 14,924 883 5.92
Total loans 189,973 7,989 4.21 176,618 8,392 4.75 152,016 7,668 5.04
Loans held for sale 2,909 157 5.40 2,977 168 5.64 2,768 193 6.97
Federal funds sold and resale agreements 960 8 .83 1,594 22 1.38 2,297 33 1.44
Other 9,484 230 2.43 6,549 226 3.45 7,571 214 2.83
Total interest-earning assets/interest income 260,645 10,175 3.90 248,554 10,878 4.38 224,340 10,298 4.59
Noninterest-earning assets:
Allowance for loan and lease losses (3,796) (4,157) (4,656)
Cash and due from banks 3,953 3,877 3,565
Other 44,964 46,751 42,086
Total assets $305,766 $295,025 $265,335
Liabilities and Equity
Interest-bearing liabilities:
Interest-bearing deposits
Money market $ 70,567 $ 128 .18% $ 65,933 $ 138 .21% $ 58,765 $ 184 .31%
Demand 40,144 18 .04 34,342 14 .04 27,563 23 .08
Savings 10,954 10 .09 9,863 9 .09 8,185 15 .18
Retail certificates of deposit 22,274 180 .81 26,609 210 .79 34,009 428 1.26
Time deposits in foreign offices and other time 2,061 8 .39 3,195 15 .47 2,815 18 .64
Total interest-bearing deposits 146,000 344 .24 139,942 386 .28 131,337 668 .51
Borrowed funds
Federal funds purchased and repurchase agreements 3,884 6 .15 4,542 10 .22 4,469 7 .16
Federal Home Loan Bank borrowings 8,617 45 .52 9,678 72 .74 5,305 53 1.00
Bank notes and senior debt 11,221 191 1.70 10,275 236 2.30 11,202 252 2.25
Subordinated debt 7,373 205 2.78 7,019 320 4.56 8,942 456 5.10
Commercial paper 6,902 16 .23 8,383 23 .27 3,234 9 .28
Other 2,025 53 2.62 1,947 47 2.41 2,574 49 1.90
Total borrowed funds 40,022 516 1.29 41,844 708 1.69 35,726 826 2.31
Total interest-bearing liabilities/interest expense 186,022 860 .46 181,786 1,094 .60 167,063 1,494 .89
Noninterest-bearing liabilities and equity:
Noninterest-bearing deposits 66,168 61,610 51,707
Allowance for unfunded loan commitments and letters of credit 241 237 203
Accrued expenses and other liabilities 10,961 11,350 11,040
Equity 42,374 40,042 35,322
Total liabilities and equity $305,766 $295,025 $265,335
Interest rate spread 3.44 3.78 3.70
Impact of noninterest-bearing sources .13 .16 .22
Net interest income/margin $ 9,315 3.57% $ 9,784 3.94% $ 8,804 3.92%
(continued on following page)
The PNC Financial Services Group, Inc. – Form 10-K 223