PNC Bank 2013 Annual Report Download - page 75
Download and view the complete annual report
Please find page 75 of the 2013 PNC Bank annual report below. You can navigate through the pages in the report by either clicking on the pages listed below, or by using the keyword search tool below to find specific information within the annual report.-
 1
1 -
2
-
3
-
4
-
5
-
6
-
7
-
8
-
9
-
10
-
11
-
12
-
13
-
14
-
15
-
16
-
17
-
18
-
19
-
20
-
21
-
22
-
23
-
24
-
25
-
26
-
27
-
28
-
29
-
30
-
31
-
32
-
33
-
34
-
35
-
36
-
37
-
38
-
39
-
40
-
41
-
42
-
43
-
44
-
45
-
46
-
47
-
48
-
49
-
50
-
51
-
52
-
53
-
54
-
55
-
56
-
57
-
58
-
59
-
60
-
61
-
62
-
63
-
64
-
 65
65 -
 66
66 -
 67
67 -
 68
68 -
 69
69 -
 70
70 -
 71
71 -
 72
72 -
 73
73 -
 74
74 -
 75
75 -
 76
76 -
 77
77 -
 78
78 -
 79
79 -
 80
80 -
 81
81 -
 82
82 -
 83
83 -
 84
84 -
 85
85 -
86
-
87
-
88
-
89
-
90
-
91
-
92
-
93
-
94
-
95
-
96
-
97
-
98
-
99
-
100
-
101
-
102
-
103
-
104
-
105
-
106
-
107
-
108
-
109
-
110
-
111
-
112
-
113
-
114
-
115
-
116
-
117
-
118
-
119
-
120
-
121
-
122
-
123
-
124
-
125
-
126
-
127
-
128
-
129
-
130
-
131
-
132
-
133
-
134
-
135
-
136
-
137
-
138
-
139
-
140
-
141
-
142
-
143
-
144
-
145
-
146
-
147
-
148
-
149
-
150
-
151
-
152
-
153
-
154
-
155
-
156
-
157
-
158
-
159
-
160
-
161
-
162
-
163
-
164
-
165
-
166
-
167
-
168
-
169
-
170
-
171
-
172
-
173
-
174
-
175
-
176
-
177
-
178
-
179
-
180
-
181
-
182
-
183
-
184
-
185
-
186
-
187
-
188
-
189
-
190
-
191
-
192
-
193
-
194
-
195
-
196
-
197
-
198
-
199
-
200
-
201
-
202
-
203
-
204
-
205
-
206
-
207
-
208
-
209
-
210
-
211
-
212
-
213
-
214
-
215
-
216
-
217
-
218
-
219
-
220
-
221
-
222
-
223
-
224
-
225
-
226
-
227
-
228
-
229
-
230
-
231
-
232
-
233
-
234
-
235
-
236
-
237
-
238
-
239
-
240
-
241
-
242
-
243
-
244
-
245
-
246
-
247
-
248
-
249
-
250
-
251
-
252
-
253
-
254
-
255
-
256
-
257
-
258
-
259
-
260
-
261
-
262
-
263
-
264
-
265
-
266
 |
 |
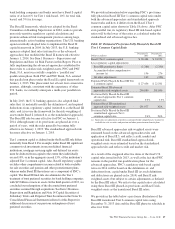
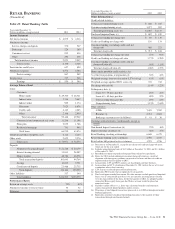
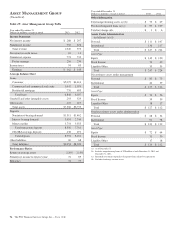
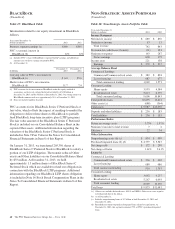
Asset Management Group earned $162 million in 2013
compared with $145 million in 2012. Assets under
administration were $247 billion as of December 31, 2013
compared to $224 billion as of December 31, 2012. Earnings
increased due to higher noninterest income from higher assets,
partially offset by higher noninterest expense from strategic
business investments.
The core growth strategies for the business include increasing
sales sourced from other PNC lines of business, maximizing
front line productivity and optimizing market presence
including additions to staff in high opportunity markets.
Through 2013, the business delivered strong sales production
and benefited from sales sourced from other PNC lines of
business.
Highlights of Asset Management Group’s performance during
2013 include the following:
• Positive net flows of approximately $4.7 billion in
discretionary assets under management after
adjustments to total net flows for cyclical client
activities,
• New primary client acquisitions increased 22% over
2012,
• Strong sales production, an increase of 14% over
2012,
• Significant sales sourced from other PNC lines of
business, an increase of 44% over 2012, and
• Continued levels of new business investment and
focused hiring to drive growth resulted in a 5%
increase in personnel.
Assets under administration increased $23 billion compared to
a year ago. Discretionary assets under management were $127
billion at December 31, 2013 compared with $112 billion at
December 31, 2012. The increase was driven by higher equity
markets and strong sales resulting in positive net flows, after
adjustments to total net flows for cyclical client activities.
Total revenue for 2013 increased $67 million to $1.0 billion
compared with $973 million for 2012, primarily relating to
noninterest income due to stronger average equity markets and
positive net flows.
Noninterest expense was $774 million in 2013, an increase of
$42 million, or 6%, from the prior year. The increase was
primarily attributable to compensation expense. Over the last
12 months, total full-time headcount has increased by
approximately 180 positions, or 5%. The business remains
focused on managing expenses as it invests in growth
opportunities.
Average deposits for 2013 increased $.7 billion, or 9%, from
the prior year. Average transaction deposits grew 10% to $8.6
billion compared with 2012 and were partially offset by the
run-off of maturing certificates of deposit. Average loan
balances of $6.8 billion increased $.7 billion, or 11%, from the
prior year due to continued growth in the consumer loan
portfolio, primarily home equity installment loans, due to
favorable interest rates.
The PNC Financial Services Group, Inc. – Form 10-K 57