PNC Bank 2013 Annual Report Download - page 161
Download and view the complete annual report
Please find page 161 of the 2013 PNC Bank annual report below. You can navigate through the pages in the report by either clicking on the pages listed below, or by using the keyword search tool below to find specific information within the annual report.-
 1
1 -
2
-
3
-
4
-
5
-
6
-
7
-
8
-
9
-
10
-
11
-
12
-
13
-
14
-
15
-
16
-
17
-
18
-
19
-
20
-
21
-
22
-
23
-
24
-
25
-
26
-
27
-
28
-
29
-
30
-
31
-
32
-
33
-
34
-
35
-
36
-
37
-
38
-
39
-
40
-
41
-
42
-
43
-
44
-
45
-
46
-
47
-
48
-
49
-
50
-
51
-
52
-
53
-
54
-
55
-
56
-
57
-
58
-
59
-
60
-
61
-
62
-
63
-
64
-
65
-
66
-
67
-
68
-
69
-
70
-
71
-
72
-
73
-
74
-
75
-
76
-
77
-
78
-
79
-
80
-
81
-
82
-
83
-
84
-
85
-
86
-
87
-
88
-
89
-
90
-
91
-
92
-
93
-
94
-
95
-
96
-
97
-
98
-
99
-
100
-
101
-
102
-
103
-
104
-
105
-
106
-
107
-
108
-
109
-
110
-
111
-
112
-
113
-
114
-
115
-
116
-
117
-
118
-
119
-
120
-
121
-
122
-
123
-
124
-
125
-
126
-
127
-
128
-
129
-
130
-
131
-
132
-
133
-
134
-
135
-
136
-
137
-
138
-
139
-
140
-
141
-
142
-
143
-
144
-
145
-
146
-
147
-
148
-
149
-
150
-
 151
151 -
 152
152 -
 153
153 -
 154
154 -
 155
155 -
 156
156 -
 157
157 -
 158
158 -
 159
159 -
 160
160 -
 161
161 -
 162
162 -
 163
163 -
 164
164 -
 165
165 -
 166
166 -
 167
167 -
 168
168 -
 169
169 -
 170
170 -
 171
171 -
172
-
173
-
174
-
175
-
176
-
177
-
178
-
179
-
180
-
181
-
182
-
183
-
184
-
185
-
186
-
187
-
188
-
189
-
190
-
191
-
192
-
193
-
194
-
195
-
196
-
197
-
198
-
199
-
200
-
201
-
202
-
203
-
204
-
205
-
206
-
207
-
208
-
209
-
210
-
211
-
212
-
213
-
214
-
215
-
216
-
217
-
218
-
219
-
220
-
221
-
222
-
223
-
224
-
225
-
226
-
227
-
228
-
229
-
230
-
231
-
232
-
233
-
234
-
235
-
236
-
237
-
238
-
239
-
240
-
241
-
242
-
243
-
244
-
245
-
246
-
247
-
248
-
249
-
250
-
251
-
252
-
253
-
254
-
255
-
256
-
257
-
258
-
259
-
260
-
261
-
262
-
263
-
264
-
265
-
266
 |
 |

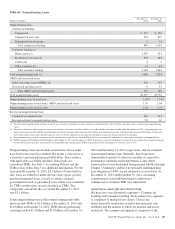
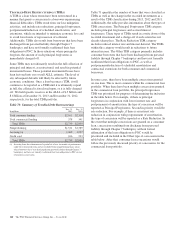
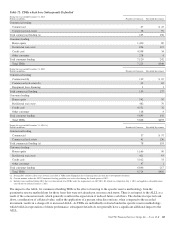
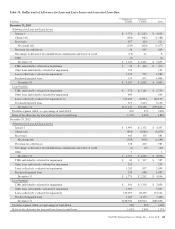
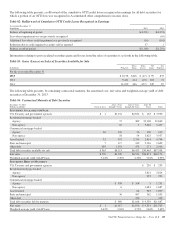
Table 72: TDRs which have Subsequently Defaulted
During the year ended December 31, 2013
Dollars in millions Number of Contracts Recorded Investment
Commercial lending
Commercial 67 $ 47
Commercial real estate 38 59
Total commercial lending (a) 105 106
Consumer lending
Home equity 1,420 89
Residential real estate 824 115
Credit card 4,598 34
Other consumer 278 4
Total consumer lending 7,120 242
Total TDRs 7,225 $348
During the year ended December 31, 2012
Dollars in millions Number of Contracts Recorded Investment
Commercial lending
Commercial (b) 112 $ 67
Commercial real estate (b) 42 69
Equipment lease financing 11
Total commercial lending 155 137
Consumer lending
Home equity 542 50
Residential real estate 482 70
Credit card 4,551 32
Other consumer 118 4
Total consumer lending 5,693 156
Total TDRs 5,848 $293
During the year ended December 31, 2011 (c)
Dollars in millions Number of Contracts Recorded Investment
Commercial lending
Commercial 37 $ 57
Commercial real estate 41 136
Total commercial lending (a) 78 193
Consumer lending
Home equity 1,166 90
Residential real estate 421 93
Credit card 5,012 33
Other consumer 47 1
Total consumer lending 6,646 217
Total TDRs 6,724 $410
(a) During 2013 and 2011, there were no loans classified as TDRs in the Equipment lease financing loan class that have subsequently defaulted.
(b) Certain amounts within the 2012 Commercial lending portfolio were reclassified during the fourth quarter of 2013.
(c) Includes loans modified during 2011 that were determined to be TDRs under the requirements of ASU 2011-02, which was adopted on July 1, 2011 and applied to all modifications
entered into on and after January 1, 2011.
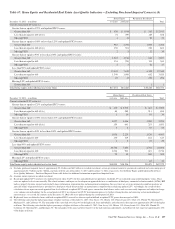
The impact to the ALLL for commercial lending TDRs is the effect of moving to the specific reserve methodology from the
quantitative reserve methodology for those loans that were not already put on nonaccrual status. There is an impact to the ALLL as a
result of the concession made, which generally results in the expectation of reduced future cash flows. The decline in expected cash
flows, consideration of collateral value, and/or the application of a present value discount rate, when compared to the recorded
investment, results in a charge-off or increased ALLL. As TDRs are individually evaluated under the specific reserve methodology,
which builds in expectations of future performance, subsequent defaults do not generally have a significant additional impact to the
ALLL.
The PNC Financial Services Group, Inc. – Form 10-K 143