PNC Bank 2013 Annual Report Download - page 181
Download and view the complete annual report
Please find page 181 of the 2013 PNC Bank annual report below. You can navigate through the pages in the report by either clicking on the pages listed below, or by using the keyword search tool below to find specific information within the annual report.-
 1
1 -
2
-
3
-
4
-
5
-
6
-
7
-
8
-
9
-
10
-
11
-
12
-
13
-
14
-
15
-
16
-
17
-
18
-
19
-
20
-
21
-
22
-
23
-
24
-
25
-
26
-
27
-
28
-
29
-
30
-
31
-
32
-
33
-
34
-
35
-
36
-
37
-
38
-
39
-
40
-
41
-
42
-
43
-
44
-
45
-
46
-
47
-
48
-
49
-
50
-
51
-
52
-
53
-
54
-
55
-
56
-
57
-
58
-
59
-
60
-
61
-
62
-
63
-
64
-
65
-
66
-
67
-
68
-
69
-
70
-
71
-
72
-
73
-
74
-
75
-
76
-
77
-
78
-
79
-
80
-
81
-
82
-
83
-
84
-
85
-
86
-
87
-
88
-
89
-
90
-
91
-
92
-
93
-
94
-
95
-
96
-
97
-
98
-
99
-
100
-
101
-
102
-
103
-
104
-
105
-
106
-
107
-
108
-
109
-
110
-
111
-
112
-
113
-
114
-
115
-
116
-
117
-
118
-
119
-
120
-
121
-
122
-
123
-
124
-
125
-
126
-
127
-
128
-
129
-
130
-
131
-
132
-
133
-
134
-
135
-
136
-
137
-
138
-
139
-
140
-
141
-
142
-
143
-
144
-
145
-
146
-
147
-
148
-
149
-
150
-
151
-
152
-
153
-
154
-
155
-
156
-
157
-
158
-
159
-
160
-
161
-
162
-
163
-
164
-
165
-
166
-
167
-
168
-
169
-
170
-
 171
171 -
 172
172 -
 173
173 -
 174
174 -
 175
175 -
 176
176 -
 177
177 -
 178
178 -
 179
179 -
 180
180 -
 181
181 -
 182
182 -
 183
183 -
 184
184 -
 185
185 -
 186
186 -
 187
187 -
 188
188 -
 189
189 -
 190
190 -
 191
191 -
192
-
193
-
194
-
195
-
196
-
197
-
198
-
199
-
200
-
201
-
202
-
203
-
204
-
205
-
206
-
207
-
208
-
209
-
210
-
211
-
212
-
213
-
214
-
215
-
216
-
217
-
218
-
219
-
220
-
221
-
222
-
223
-
224
-
225
-
226
-
227
-
228
-
229
-
230
-
231
-
232
-
233
-
234
-
235
-
236
-
237
-
238
-
239
-
240
-
241
-
242
-
243
-
244
-
245
-
246
-
247
-
248
-
249
-
250
-
251
-
252
-
253
-
254
-
255
-
256
-
257
-
258
-
259
-
260
-
261
-
262
-
263
-
264
-
265
-
266
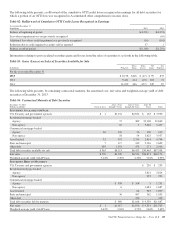
 |
 |

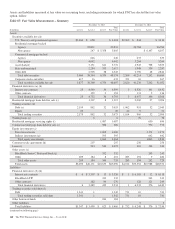
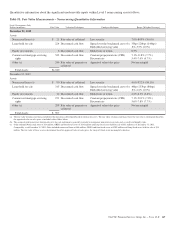
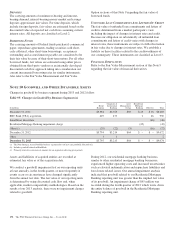
were transfers out of Level 3 residential mortgage loans held for sale and loans of $12 million and $28 million, respectively,
primarily due to the transfer of residential mortgage loans held for sale and loans to OREO. In addition, there was approximately
$84 million of Level 3 residential mortgage loans held for sale reclassified to Level 3 loans during 2013 due to the loans being
reclassified from held for sale loans to held in portfolio loans. This amount was included in Transfers out of Level 3 residential
mortgages loans held for sale and Transfers into Level 3 loans within Table 88. During 2012, there were transfers of securities
available for sale from Level 2 to Level 3 of $478 million consisting of mortgage-backed securities as a result of a ratings
downgrade which reduced the observability of valuation inputs and certain state and municipal securities with valuation inputs that
were determined to be unobservable. Level 2 to Level 3 transfers also included $127 million and $27 million for loans and
residential mortgage loans held for sale, respectively, as a result of reduced market activity in the nonperforming residential
mortgage sales market which reduced the observability of valuation inputs. Also during 2012, there was a transfer out of Level 3
securities available for sale of $40 million due to an instrument being reclassified to a loan and no longer being carried at fair
value.
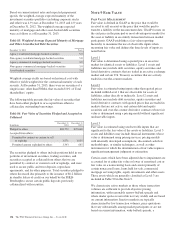
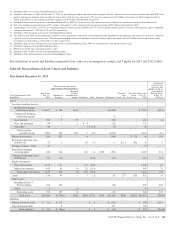
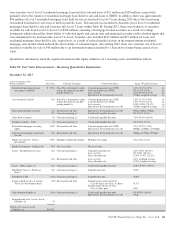
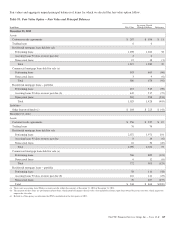
Quantitative information about the significant unobservable inputs within Level 3 recurring assets and liabilities follows.
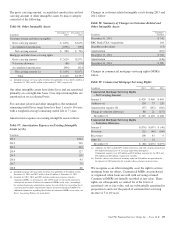
Table 89: Fair Value Measurements – Recurring Quantitative Information
December 31, 2013
Level 3 Instruments Only
Dollars in millions Fair Value Valuation Techniques Unobservable Inputs Range (Weighted Average)
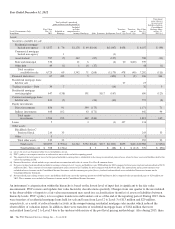
Residential mortgage-backed
non-agency securities
$ 5,358 Priced by a third-party vendor
using a discounted cash flow
pricing model (a)
Constant prepayment rate (CPR)
Constant default rate (CDR)
Loss severity
Spread over the benchmark curve (b)
1.0%-32.1% (6.0%)
0%-21.9% (6.6%)
6.1%-92.9% (52.3%)
237bps weighted average
(a)
(a)
(a)
(a)
Asset-backed securities 641 Priced by a third-party vendor
using a discounted cash flow
pricing model (a)
Constant prepayment rate (CPR)
Constant default rate (CDR)
Loss severity
Spread over the benchmark curve (b)
1.0%-11.1% (5.0%)
1.0%-13.9% (8.7%)
10.0%-100% (70.1%)
326bps weighted average
(a)
(a)
(a)
(a)
State and municipal securities 132
201
Discounted cash flow
Consensus pricing (c)
Spread over the benchmark curve (b)
Credit and Liquidity discount
80bps-240bps (97bps)
0%-25.0% (8.3%)
Other debt securities 38 Consensus pricing (c) Credit and Liquidity discount 7.0%-95.0% (88.4%)
Trading securities – Debt 32 Consensus pricing (c) Credit and Liquidity discount 0%-20.0% (8.3%)
Residential mortgage servicing
rights
1,087 Discounted cash flow Constant prepayment rate (CPR)
Spread over the benchmark curve (b)
2.2%-32.9% (7.6%)
889bps-1,888bps (1,024bps)
Commercial mortgage loans held
for sale
586 Discounted cash flow Spread over the benchmark curve (b) 460bps-6,655bps (972bps)
Equity investments – Direct
investments
1,069 Multiple of adjusted earnings Multiple of earnings 4.5x-10.8x (7.2x)
Equity investments – Indirect (d) 595 Net asset value Net asset value
Loans – Residential real estate 225 Consensus pricing (c) Cumulative default rate
Loss severity
Gross discount rate
2.0%-100% (80.0%)
0%-100% (48.4%)
12.0%-13.0% (12.2%)
164 Discounted cash flow Loss severity
Gross discount rate
8.0% weighted average
10.0% weighted average
Loans – Home equity (e) 123 Consensus pricing (c) Credit and Liquidity discount 36.0%-99.0% (55.0%)
BlackRock Series C Preferred
Stock
332 Consensus pricing (c) Liquidity discount 20.0%
BlackRock LTIP (332) Consensus pricing (c) Liquidity discount 20.0%
Swaps related to sales of certain
Visa Class B common shares
(90) Discounted cash flow Estimated conversion factor of
Class B shares into Class A shares
Estimated growth rate of Visa
Class A share price
41.7%
8.6%
Other borrowed funds (e) (184) Consensus pricing (c) Credit and Liquidity discount
Spread over the benchmark curve (b)
0%-99.0% (18.0%)
13bps
Insignificant Level 3 assets, net of
liabilities (f) 35
Total Level 3 assets, net of
liabilities (g) $10,012
The PNC Financial Services Group, Inc. – Form 10-K 163