PNC Bank 2013 Annual Report Download - page 165
Download and view the complete annual report
Please find page 165 of the 2013 PNC Bank annual report below. You can navigate through the pages in the report by either clicking on the pages listed below, or by using the keyword search tool below to find specific information within the annual report.-
 1
1 -
2
-
3
-
4
-
5
-
6
-
7
-
8
-
9
-
10
-
11
-
12
-
13
-
14
-
15
-
16
-
17
-
18
-
19
-
20
-
21
-
22
-
23
-
24
-
25
-
26
-
27
-
28
-
29
-
30
-
31
-
32
-
33
-
34
-
35
-
36
-
37
-
38
-
39
-
40
-
41
-
42
-
43
-
44
-
45
-
46
-
47
-
48
-
49
-
50
-
51
-
52
-
53
-
54
-
55
-
56
-
57
-
58
-
59
-
60
-
61
-
62
-
63
-
64
-
65
-
66
-
67
-
68
-
69
-
70
-
71
-
72
-
73
-
74
-
75
-
76
-
77
-
78
-
79
-
80
-
81
-
82
-
83
-
84
-
85
-
86
-
87
-
88
-
89
-
90
-
91
-
92
-
93
-
94
-
95
-
96
-
97
-
98
-
99
-
100
-
101
-
102
-
103
-
104
-
105
-
106
-
107
-
108
-
109
-
110
-
111
-
112
-
113
-
114
-
115
-
116
-
117
-
118
-
119
-
120
-
121
-
122
-
123
-
124
-
125
-
126
-
127
-
128
-
129
-
130
-
131
-
132
-
133
-
134
-
135
-
136
-
137
-
138
-
139
-
140
-
141
-
142
-
143
-
144
-
145
-
146
-
147
-
148
-
149
-
150
-
151
-
152
-
153
-
154
-
 155
155 -
 156
156 -
 157
157 -
 158
158 -
 159
159 -
 160
160 -
 161
161 -
 162
162 -
 163
163 -
 164
164 -
 165
165 -
 166
166 -
 167
167 -
 168
168 -
 169
169 -
 170
170 -
 171
171 -
 172
172 -
 173
173 -
 174
174 -
 175
175 -
176
-
177
-
178
-
179
-
180
-
181
-
182
-
183
-
184
-
185
-
186
-
187
-
188
-
189
-
190
-
191
-
192
-
193
-
194
-
195
-
196
-
197
-
198
-
199
-
200
-
201
-
202
-
203
-
204
-
205
-
206
-
207
-
208
-
209
-
210
-
211
-
212
-
213
-
214
-
215
-
216
-
217
-
218
-
219
-
220
-
221
-
222
-
223
-
224
-
225
-
226
-
227
-
228
-
229
-
230
-
231
-
232
-
233
-
234
-
235
-
236
-
237
-
238
-
239
-
240
-
241
-
242
-
243
-
244
-
245
-
246
-
247
-
248
-
249
-
250
-
251
-
252
-
253
-
254
-
255
-
256
-
257
-
258
-
259
-
260
-
261
-
262
-
263
-
264
-
265
-
266
 |
 |

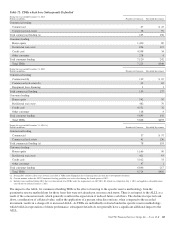
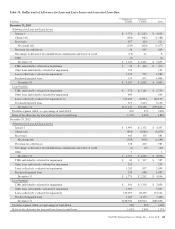
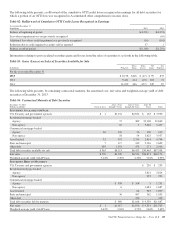
Table 76: Rollforward of Allowance for Loan and Lease Losses and Associated Loan Data
In millions
Commercial
Lending
Consumer
Lending Total
December 31, 2013
Allowance for Loan and Lease Losses
January 1 $ 1,774 $ 2,262 $ 4,036
Charge-offs (606) (982) (1,588)
Recoveries 357 154 511
Net charge-offs (249) (828) (1,077)
Provision for credit losses 36 607 643
Net change in allowance for unfunded loan commitments and letters of credit (13) 21 8
Other (1) (1)
December 31 $ 1,547 $ 2,062 $ 3,609
TDRs individually evaluated for impairment $ 24 $ 446 $ 470
Other loans individually evaluated for impairment 155 155
Loans collectively evaluated for impairment 1,235 745 1,980
Purchased impaired loans 133 871 1,004
December 31 $ 1,547 $ 2,062 $ 3,609
Loan Portfolio
TDRs individually evaluated for impairment $ 578 $ 2,161 $ 2,739
Other loans individually evaluated for impairment 649 649
Loans collectively evaluated for impairment (a) 115,245 70,874 186,119
Purchased impaired loans 673 5,433 6,106
December 31 $117,145 $78,468 $195,613
Portfolio segment ALLL as a percentage of total ALLL 43% 57% 100%
Ratio of the allowance for loan and lease losses to total loans 1.32% 2.63% 1.84%
December 31, 2012
Allowance for Loan and Lease Losses
January 1 $ 1,995 $ 2,352 $ 4,347
Charge-offs (804) (1,066) (1,870)
Recoveries 445 136 581
Net charge-offs (359) (930) (1,289)
Provision for credit losses 138 849 987
Net change in allowance for unfunded loan commitments and letters of credit (1) (9) (10)
Other 11
December 31 $ 1,774 $ 2,262 $ 4,036
TDRs individually evaluated for impairment $ 40 $ 547 $ 587
Other loans individually evaluated for impairment 253 253
Loans collectively evaluated for impairment 1,242 857 2,099
Purchased impaired loans 239 858 1,097
December 31 $ 1,774 $ 2,262 $ 4,036
Loan Portfolio
TDRs individually evaluated for impairment $ 541 $ 2,318 $ 2,859
Other loans individually evaluated for impairment 1,057 1,057
Loans collectively evaluated for impairment 106,095 68,439 174,534
Purchased impaired loans 1,249 6,157 7,406
December 31 $108,942 $76,914 $185,856
Portfolio segment ALLL as a percentage of total ALLL 44% 56% 100%
Ratio of the allowance for loan and lease losses to total loans 1.63% 2.94% 2.17%
The PNC Financial Services Group, Inc. – Form 10-K 147