PNC Bank 2013 Annual Report Download - page 239
Download and view the complete annual report
Please find page 239 of the 2013 PNC Bank annual report below. You can navigate through the pages in the report by either clicking on the pages listed below, or by using the keyword search tool below to find specific information within the annual report.-
 1
1 -
2
-
3
-
4
-
5
-
6
-
7
-
8
-
9
-
10
-
11
-
12
-
13
-
14
-
15
-
16
-
17
-
18
-
19
-
20
-
21
-
22
-
23
-
24
-
25
-
26
-
27
-
28
-
29
-
30
-
31
-
32
-
33
-
34
-
35
-
36
-
37
-
38
-
39
-
40
-
41
-
42
-
43
-
44
-
45
-
46
-
47
-
48
-
49
-
50
-
51
-
52
-
53
-
54
-
55
-
56
-
57
-
58
-
59
-
60
-
61
-
62
-
63
-
64
-
65
-
66
-
67
-
68
-
69
-
70
-
71
-
72
-
73
-
74
-
75
-
76
-
77
-
78
-
79
-
80
-
81
-
82
-
83
-
84
-
85
-
86
-
87
-
88
-
89
-
90
-
91
-
92
-
93
-
94
-
95
-
96
-
97
-
98
-
99
-
100
-
101
-
102
-
103
-
104
-
105
-
106
-
107
-
108
-
109
-
110
-
111
-
112
-
113
-
114
-
115
-
116
-
117
-
118
-
119
-
120
-
121
-
122
-
123
-
124
-
125
-
126
-
127
-
128
-
129
-
130
-
131
-
132
-
133
-
134
-
135
-
136
-
137
-
138
-
139
-
140
-
141
-
142
-
143
-
144
-
145
-
146
-
147
-
148
-
149
-
150
-
151
-
152
-
153
-
154
-
155
-
156
-
157
-
158
-
159
-
160
-
161
-
162
-
163
-
164
-
165
-
166
-
167
-
168
-
169
-
170
-
171
-
172
-
173
-
174
-
175
-
176
-
177
-
178
-
179
-
180
-
181
-
182
-
183
-
184
-
185
-
186
-
187
-
188
-
189
-
190
-
191
-
192
-
193
-
194
-
195
-
196
-
197
-
198
-
199
-
200
-
201
-
202
-
203
-
204
-
205
-
206
-
207
-
208
-
209
-
210
-
211
-
212
-
213
-
214
-
215
-
216
-
217
-
218
-
219
-
220
-
221
-
222
-
223
-
224
-
225
-
226
-
227
-
228
-
 229
229 -
 230
230 -
 231
231 -
 232
232 -
 233
233 -
 234
234 -
 235
235 -
 236
236 -
 237
237 -
 238
238 -
 239
239 -
 240
240 -
 241
241 -
 242
242 -
 243
243 -
 244
244 -
 245
245 -
 246
246 -
 247
247 -
 248
248 -
 249
249 -
250
-
251
-
252
-
253
-
254
-
255
-
256
-
257
-
258
-
259
-
260
-
261
-
262
-
263
-
264
-
265
-
266
 |
 |

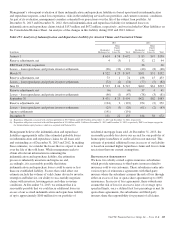
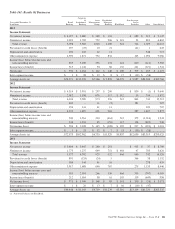
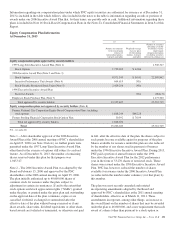
Table 161: Results Of Businesses
Year ended December 31
In millions
Retail
Banking
Corporate
&
Institutional
Banking
Asset
Management
Group
Residential
Mortgage
Banking BlackRock
Non-Strategic
Assets
Portfolio Other Consolidated
2013
Income Statement
Net interest income $ 4,077 $ 3,680 $ 288 $ 194 $ 689 $ 219 $ 9,147
Noninterest income 2,021 1,702 752 906 $ 621 53 810 6,865
Total revenue 6,098 5,382 1,040 1,100 621 742 1,029 16,012
Provision for credit losses (benefit) 657 (25) 10 21 (21) 1 643
Depreciation and amortization 186 128 42 11 348 715
Other noninterest expense 4,390 1,871 732 834 163 1,096 9,086
Income (loss) before income taxes and
noncontrolling interests 865 3,408 256 234 621 600 (416) 5,568
Income taxes (benefit) 315 1,144 94 86 152 221 (671) 1,341
Net income $ 550 $ 2,264 $ 162 $ 148 $ 469 $ 379 $ 255 $ 4,227
Inter-segment revenue $ 3 $ 28 $ 12 $ 8 $ 17 $ (10) $ (58)
Average Assets (a) $74,971 $112,970 $7,366 $ 9,896 $6,272 $ 9,987 $84,304 $305,766
2012
Income Statement
Net interest income $ 4,314 $ 3,991 $ 297 $ 209 $ 830 $ (1) $ 9,640
Noninterest income 2,012 1,598 676 317 $ 512 13 744 5,872
Total revenue 6,326 5,589 973 526 512 843 743 15,512
Provision for credit losses (benefit) 800 – 11 (5) 181 – 987
Depreciation and amortization 194 141 41 11 320 707
Other noninterest expense 4,392 1,887 691 981 287 1,637 9,875
Income (loss) before income taxes and
noncontrolling interests 940 3,561 230 (461) 512 375 (1,214) 3,943
Income taxes (benefit) 344 1,233 85 (153) 117 138 (822) 942
Net income (loss) $ 596 $ 2,328 $ 145 $ (308) $ 395 $ 237 $ (392) $ 3,001
Inter-segment revenue $ 1 $ 33 $ 12 $ 7 $ 15 $ (10) $ (58)
Average Assets (a) $72,573 $102,962 $6,735 $11,529 $5,857 $12,050 $83,319 $295,025
2011
Income Statement
Net interest income $ 3,804 $ 3,465 $ 280 $ 201 $ 913 $ 37 $ 8,700
Noninterest income 1,773 1,237 649 751 $ 464 47 705 5,626
Total revenue 5,577 4,702 929 952 464 960 742 14,326
Provision for credit losses (benefit) 891 (124) (24) 5 366 38 1,152
Depreciation and amortization 186 144 41 10 278 659
Other noninterest expense 3,917 1,688 646 787 275 1,133 8,446
Income (loss) before income taxes and
noncontrolling interests 583 2,994 266 150 464 319 (707) 4,069
Income taxes (benefit) 212 1,054 98 61 103 119 (649) 998
Net income (loss) $ 371 $ 1,940 $ 168 $ 89 $ 361 $ 200 $ (58) $ 3,071
Inter-segment revenue $ 1 $ 20 $ 13 $ 7 $ 16 $ (10) $ (47)
Average Assets (a) $66,448 $ 81,043 $6,719 $11,270 $5,516 $13,119 $81,220 $265,335
(a) Period-end balances for BlackRock.
The PNC Financial Services Group, Inc. – Form 10-K 221