PNC Bank 2013 Annual Report Download - page 220
Download and view the complete annual report
Please find page 220 of the 2013 PNC Bank annual report below. You can navigate through the pages in the report by either clicking on the pages listed below, or by using the keyword search tool below to find specific information within the annual report.-
 1
1 -
2
-
3
-
4
-
5
-
6
-
7
-
8
-
9
-
10
-
11
-
12
-
13
-
14
-
15
-
16
-
17
-
18
-
19
-
20
-
21
-
22
-
23
-
24
-
25
-
26
-
27
-
28
-
29
-
30
-
31
-
32
-
33
-
34
-
35
-
36
-
37
-
38
-
39
-
40
-
41
-
42
-
43
-
44
-
45
-
46
-
47
-
48
-
49
-
50
-
51
-
52
-
53
-
54
-
55
-
56
-
57
-
58
-
59
-
60
-
61
-
62
-
63
-
64
-
65
-
66
-
67
-
68
-
69
-
70
-
71
-
72
-
73
-
74
-
75
-
76
-
77
-
78
-
79
-
80
-
81
-
82
-
83
-
84
-
85
-
86
-
87
-
88
-
89
-
90
-
91
-
92
-
93
-
94
-
95
-
96
-
97
-
98
-
99
-
100
-
101
-
102
-
103
-
104
-
105
-
106
-
107
-
108
-
109
-
110
-
111
-
112
-
113
-
114
-
115
-
116
-
117
-
118
-
119
-
120
-
121
-
122
-
123
-
124
-
125
-
126
-
127
-
128
-
129
-
130
-
131
-
132
-
133
-
134
-
135
-
136
-
137
-
138
-
139
-
140
-
141
-
142
-
143
-
144
-
145
-
146
-
147
-
148
-
149
-
150
-
151
-
152
-
153
-
154
-
155
-
156
-
157
-
158
-
159
-
160
-
161
-
162
-
163
-
164
-
165
-
166
-
167
-
168
-
169
-
170
-
171
-
172
-
173
-
174
-
175
-
176
-
177
-
178
-
179
-
180
-
181
-
182
-
183
-
184
-
185
-
186
-
187
-
188
-
189
-
190
-
191
-
192
-
193
-
194
-
195
-
196
-
197
-
198
-
199
-
200
-
201
-
202
-
203
-
204
-
205
-
206
-
207
-
208
-
209
-
 210
210 -
 211
211 -
 212
212 -
 213
213 -
 214
214 -
 215
215 -
 216
216 -
 217
217 -
 218
218 -
 219
219 -
 220
220 -
 221
221 -
 222
222 -
 223
223 -
 224
224 -
 225
225 -
 226
226 -
 227
227 -
 228
228 -
 229
229 -
 230
230 -
231
-
232
-
233
-
234
-
235
-
236
-
237
-
238
-
239
-
240
-
241
-
242
-
243
-
244
-
245
-
246
-
247
-
248
-
249
-
250
-
251
-
252
-
253
-
254
-
255
-
256
-
257
-
258
-
259
-
260
-
261
-
262
-
263
-
264
-
265
-
266
 |
 |

N
OTE
21 I
NCOME
T
AXES
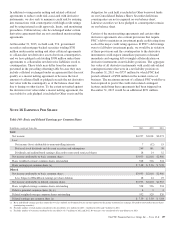
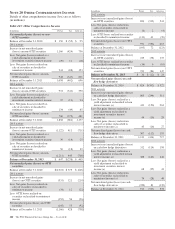
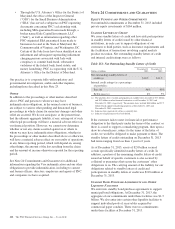
The components of Income taxes are as follows:
Table 145: Components of Income Taxes
Year ended December 31
In millions 2013 2012 2011
Current
Federal $ 117 $343 $191
State 17 29 (33)
Total current 134 372 158
Deferred
Federal 1,129 522 783
State 78 48 57
Total deferred 1,207 570 840
Total $1,341 $942 $998
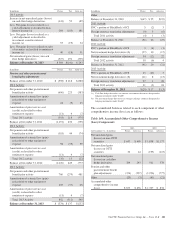
Significant components of deferred tax assets and liabilities
are as follows:
Table 146: Deferred Tax Assets and Liabilities
December 31 – in millions 2013 2012
Deferred tax assets
Allowance for loan and lease losses $1,343 $1,681
Compensation and benefits 581 790
Basis difference in loans 284
Loss and credit carryforward 797 766
Accrued expenses 575 835
Other 536 650
Total gross deferred tax assets 3,832 5,006
Valuation allowance (61) (54)
Total deferred tax assets 3,771 4,952
Deferred tax liabilities
Leasing 1,498 1,396
Goodwill and intangibles 342 363
Basis difference in loans 48
Fixed assets 397 398
Net unrealized gains on securities and
financial instruments 391 939
BlackRock basis difference 2,031 1,874
Other 730 543
Total deferred tax liabilities 5,437 5,513
Net deferred tax liability $1,666 $ 561
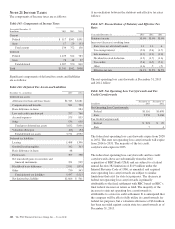
A reconciliation between the statutory and effective tax rates
follows:
Table 147: Reconciliation of Statutory and Effective Tax
Rates
Year ended December 31 2013 2012 2011
Statutory tax rate 35.0% 35.0% 35.0%
Increases (decreases) resulting from
State taxes net of federal benefit 1.1 1.3 .4
Tax-exempt interest (2.0) (2.4) (1.7)
Life insurance (1.7) (2.3) (2.0)
Dividend received deduction (1.3) (1.7) (1.6)
Tax credits (5.4) (6.5) (5.1)
Other (1.6) .5 (.5)
Effective tax rate 24.1% 23.9% 24.5%
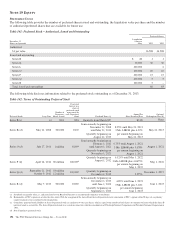
The net operating loss carryforwards at December 31, 2013
and 2012 follow:
Table 148: Net Operating Loss Carryforwards and Tax
Credit Carryforwards
In millions
December 31
2013
December 31
2012
Net Operating Loss Carryforwards:
Federal $1,116 $1,698
State 2,958 2,468
Tax Credit Carryforwards:
Federal $ 221 $ 29
State 7 4
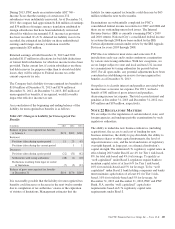
The federal net operating loss carryforwards expire from 2028
to 2032. The state net operating loss carryforwards will expire
from 2014 to 2031. The majority of the tax credit
carryforwards expire in 2033.
The federal net operating loss carryforwards and tax credit
carryforwards above are substantially from the 2012
acquisition of RBC Bank (USA) and are subject to a federal
annual Section 382 limitation of $119 million under the
Internal Revenue Code of 1986, as amended; and acquired
state operating loss carryforwards are subject to similar
limitations that exist for state tax purposes. The decrease in
federal net operating loss carryforwards is primarily
attributable to the final settlement with RBC based on RBC’s
final federal income tax return as filed. The majority of the
increase to state net operating loss carryforwards is
attributable to a state tax audit settlement. It is anticipated that
the company will be able to fully utilize its carryforwards for
federal tax purposes, but a valuation allowance of $61 million
has been recorded against certain state tax carryforwards as of
December 31, 2013.
202 The PNC Financial Services Group, Inc. – Form 10-K