PNC Bank 2013 Annual Report Download - page 154
Download and view the complete annual report
Please find page 154 of the 2013 PNC Bank annual report below. You can navigate through the pages in the report by either clicking on the pages listed below, or by using the keyword search tool below to find specific information within the annual report.-
 1
1 -
2
-
3
-
4
-
5
-
6
-
7
-
8
-
9
-
10
-
11
-
12
-
13
-
14
-
15
-
16
-
17
-
18
-
19
-
20
-
21
-
22
-
23
-
24
-
25
-
26
-
27
-
28
-
29
-
30
-
31
-
32
-
33
-
34
-
35
-
36
-
37
-
38
-
39
-
40
-
41
-
42
-
43
-
44
-
45
-
46
-
47
-
48
-
49
-
50
-
51
-
52
-
53
-
54
-
55
-
56
-
57
-
58
-
59
-
60
-
61
-
62
-
63
-
64
-
65
-
66
-
67
-
68
-
69
-
70
-
71
-
72
-
73
-
74
-
75
-
76
-
77
-
78
-
79
-
80
-
81
-
82
-
83
-
84
-
85
-
86
-
87
-
88
-
89
-
90
-
91
-
92
-
93
-
94
-
95
-
96
-
97
-
98
-
99
-
100
-
101
-
102
-
103
-
104
-
105
-
106
-
107
-
108
-
109
-
110
-
111
-
112
-
113
-
114
-
115
-
116
-
117
-
118
-
119
-
120
-
121
-
122
-
123
-
124
-
125
-
126
-
127
-
128
-
129
-
130
-
131
-
132
-
133
-
134
-
135
-
136
-
137
-
138
-
139
-
140
-
141
-
142
-
143
-
 144
144 -
 145
145 -
 146
146 -
 147
147 -
 148
148 -
 149
149 -
 150
150 -
 151
151 -
 152
152 -
 153
153 -
 154
154 -
 155
155 -
 156
156 -
 157
157 -
 158
158 -
 159
159 -
 160
160 -
 161
161 -
 162
162 -
 163
163 -
 164
164 -
165
-
166
-
167
-
168
-
169
-
170
-
171
-
172
-
173
-
174
-
175
-
176
-
177
-
178
-
179
-
180
-
181
-
182
-
183
-
184
-
185
-
186
-
187
-
188
-
189
-
190
-
191
-
192
-
193
-
194
-
195
-
196
-
197
-
198
-
199
-
200
-
201
-
202
-
203
-
204
-
205
-
206
-
207
-
208
-
209
-
210
-
211
-
212
-
213
-
214
-
215
-
216
-
217
-
218
-
219
-
220
-
221
-
222
-
223
-
224
-
225
-
226
-
227
-
228
-
229
-
230
-
231
-
232
-
233
-
234
-
235
-
236
-
237
-
238
-
239
-
240
-
241
-
242
-
243
-
244
-
245
-
246
-
247
-
248
-
249
-
250
-
251
-
252
-
253
-
254
-
255
-
256
-
257
-
258
-
259
-
260
-
261
-
262
-
263
-
264
-
265
-
266
 |
 |

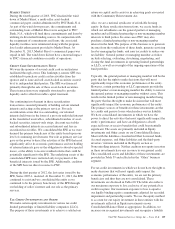
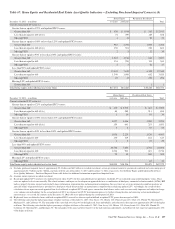
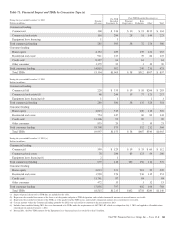
is used to monitor the risk in the loan classes. Loans with
higher FICO scores and lower LTVs tend to have a lower
level of risk. Conversely, loans with lower FICO scores,
higher LTVs, and in certain geographic locations tend to have
a higher level of risk.
In the first quarter of 2013, we refined our process for the
Home Equity and Residential Real Estate Asset Quality
Indicators shown in the following tables. These refinements
include, but are not limited to, improvements in the process
for determining lien position and LTV in both Table 67 and
Table 68. Additionally, as of the first quarter of 2013, we are
now presenting Table 67 at recorded investment as opposed to
our prior presentation of outstanding balance. Table 68
continues to be presented at outstanding balance. Both the
2013 and 2012 period end balance disclosures are presented in
the below tables using this refined process.
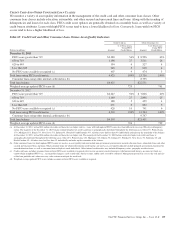
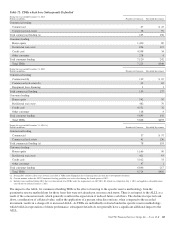
C
ONSUMER
P
URCHASED
I
MPAIRED
L
OAN
C
LASS
Estimates of the expected cash flows primarily determine the
credit impacts of consumer purchased impaired loans.
Consumer cash flow estimates are influenced by a number of
credit related items, which include, but are not limited to:
estimated real estate values, payment patterns, updated FICO
scores, the current economic environment, updated LTV ratios
and the date of origination. These key factors are monitored to
help ensure that concentrations of risk are mitigated and cash
flows are maximized.
See Note 6 Purchased Loans for additional information.
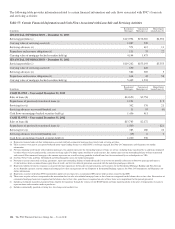
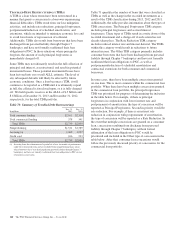
Table 66: Home Equity and Residential Real Estate
Balances
In millions
December 31
2013
December 31
2012
Home equity and residential real estate
loans – excluding purchased impaired
loans (a) $44,376 $42,725
Home equity and residential real estate
loans – purchased impaired loans (b) 5,548 6,638
Government insured or guaranteed
residential real estate mortgages (a) 1,704 2,279
Purchase accounting adjustments –
purchased impaired loans (116) (482)
Total home equity and residential real
estate loans (a) $51,512 $51,160
(a) Represents recorded investment.
(b) Represents outstanding balance.
136 The PNC Financial Services Group, Inc. – Form 10-K