PNC Bank 2013 Annual Report Download - page 100
Download and view the complete annual report
Please find page 100 of the 2013 PNC Bank annual report below. You can navigate through the pages in the report by either clicking on the pages listed below, or by using the keyword search tool below to find specific information within the annual report.-
 1
1 -
2
-
3
-
4
-
5
-
6
-
7
-
8
-
9
-
10
-
11
-
12
-
13
-
14
-
15
-
16
-
17
-
18
-
19
-
20
-
21
-
22
-
23
-
24
-
25
-
26
-
27
-
28
-
29
-
30
-
31
-
32
-
33
-
34
-
35
-
36
-
37
-
38
-
39
-
40
-
41
-
42
-
43
-
44
-
45
-
46
-
47
-
48
-
49
-
50
-
51
-
52
-
53
-
54
-
55
-
56
-
57
-
58
-
59
-
60
-
61
-
62
-
63
-
64
-
65
-
66
-
67
-
68
-
69
-
70
-
71
-
72
-
73
-
74
-
75
-
76
-
77
-
78
-
79
-
80
-
81
-
82
-
83
-
84
-
85
-
86
-
87
-
88
-
89
-
 90
90 -
 91
91 -
 92
92 -
 93
93 -
 94
94 -
 95
95 -
 96
96 -
 97
97 -
 98
98 -
 99
99 -
 100
100 -
 101
101 -
 102
102 -
 103
103 -
 104
104 -
 105
105 -
 106
106 -
 107
107 -
 108
108 -
 109
109 -
 110
110 -
111
-
112
-
113
-
114
-
115
-
116
-
117
-
118
-
119
-
120
-
121
-
122
-
123
-
124
-
125
-
126
-
127
-
128
-
129
-
130
-
131
-
132
-
133
-
134
-
135
-
136
-
137
-
138
-
139
-
140
-
141
-
142
-
143
-
144
-
145
-
146
-
147
-
148
-
149
-
150
-
151
-
152
-
153
-
154
-
155
-
156
-
157
-
158
-
159
-
160
-
161
-
162
-
163
-
164
-
165
-
166
-
167
-
168
-
169
-
170
-
171
-
172
-
173
-
174
-
175
-
176
-
177
-
178
-
179
-
180
-
181
-
182
-
183
-
184
-
185
-
186
-
187
-
188
-
189
-
190
-
191
-
192
-
193
-
194
-
195
-
196
-
197
-
198
-
199
-
200
-
201
-
202
-
203
-
204
-
205
-
206
-
207
-
208
-
209
-
210
-
211
-
212
-
213
-
214
-
215
-
216
-
217
-
218
-
219
-
220
-
221
-
222
-
223
-
224
-
225
-
226
-
227
-
228
-
229
-
230
-
231
-
232
-
233
-
234
-
235
-
236
-
237
-
238
-
239
-
240
-
241
-
242
-
243
-
244
-
245
-
246
-
247
-
248
-
249
-
250
-
251
-
252
-
253
-
254
-
255
-
256
-
257
-
258
-
259
-
260
-
261
-
262
-
263
-
264
-
265
-
266
 |
 |

T
ROUBLED
D
EBT
R
ESTRUCTURINGS
A TDR is a loan whose terms have been restructured in a
manner that grants a concession to a borrower experiencing
financial difficulties. TDRs result from our loss mitigation
activities and include rate reductions, principal forgiveness,
postponement/reduction of scheduled amortization and
extensions, which are intended to minimize economic loss and
to avoid foreclosure or repossession of collateral.
Additionally, TDRs also result from borrowers that have been
discharged from personal liability through Chapter 7
bankruptcy and have not formally reaffirmed their loan
obligations to PNC. For the twelve months ended
December 31, 2013, $2.3 billion of loans held for sale, loans
accounted for under the fair value option and pooled
purchased impaired loans, as well as certain consumer
government insured or guaranteed loans, were excluded from
the TDR population. The comparable amount for the twelve
months ended December 31, 2012 was $3.1 billion.
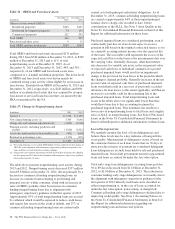
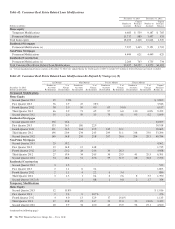
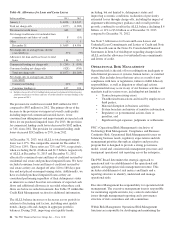
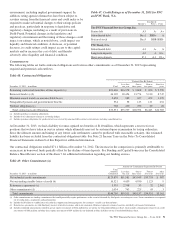
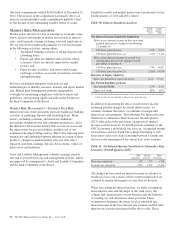
Table 44: Summary of Troubled Debt Restructurings
In millions
December 31
2013
December 31
2012
Consumer lending:
Real estate-related $1,939 $2,028
Credit card 166 233
Other consumer 56 57
Total consumer lending 2,161 2,318
Total commercial lending 578 541
Total TDRs $2,739 $2,859
Nonperforming $1,511 $1,589
Accruing (a) 1,062 1,037
Credit card 166 233
Total TDRs $2,739 $2,859
(a) Accruing loans have demonstrated a period of at least six months of performance
under the restructured terms and are excluded from nonperforming loans. Loans
where borrowers have been discharged from personal liability through Chapter 7
bankruptcy and have not formally reaffirmed their loan obligations to PNC are not
returned to accrual status.
Total TDRs decreased $120 million, or 4%, during 2013.
Nonperforming TDRs totaled $1.5 billion, which represents
approximately 49% of total nonperforming loans.
TDRs that are performing (accruing) are excluded from
nonperforming loans. Generally, these loans have been
returned to performing status as the borrowers are performing
under the restructured terms for at least six consecutive
months. These TDRs increased $25 million, or 2%, during
2013 to $1.1 billion as of December 31, 2013. This increase
reflects the further seasoning and performance of the TDRs.
Loans where borrowers have been discharged from personal
liability through Chapter 7 bankruptcy and have not formally
reaffirmed their loan obligations to PNC are not returned to
accrual status. See Note 5 Asset Quality in the Notes To
Consolidated Financial Statements in this Report for
additional information.
A
LLOWANCES FOR
L
OAN AND
L
EASE
L
OSSES AND
U
NFUNDED
L
OAN
C
OMMITMENTS AND
L
ETTERS OF
C
REDIT
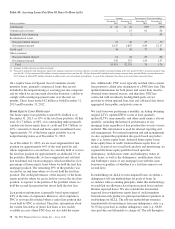
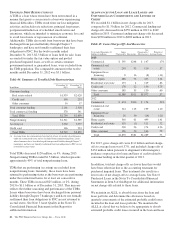
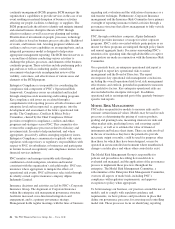
We recorded $1.1 billion in net charge-offs for 2013,
compared to $1.3 billion for 2012. Commercial lending net
charge-offs decreased from $359 million in 2012 to $249
million in 2013. Consumer lending net charge-offs decreased
from $930 million in 2012 to $828 million in 2013.
Table 45: Loan Charge-Offs And Recoveries
Year ended December 31
Dollars in millions
Gross
Charge-offs Recoveries
Net
Charge-offs /
(Recoveries)
Percent of
Average Loans
2013
Commercial $ 395 $248 $ 147 .17%
Commercial real
estate 203 93 110 .57
Equipment lease
financing 8 16 (8) (.11)
Home equity 486 73 413 1.14
Residential real estate 133 4 129 .86
Credit card 178 22 156 3.75
Other consumer 185 55 130 .60
Total $1,588 $511 $1,077 .57
2012
Commercial $ 474 $300 $ 174 .23%
Commercial real
estate 314 115 199 1.10
Equipment lease
financing 16 30 (14) (.21)
Home equity 560 61 499 1.41
Residential real estate 110 (1) 111 .72
Credit card 200 26 174 4.26
Other consumer 196 50 146 .72
Total $1,870 $581 $1,289 .73
For 2013, gross charge-offs were $1.6 billion and net charge-
offs to average loans was 0.57%, and included charge-offs of
$134 million taken pursuant to alignment with interagency
guidance on practices for loans and lines of credit related to
consumer lending in the first quarter of 2013.
In addition, total net charge-offs are lower than they would
have been otherwise due to the accounting treatment for
purchased impaired loans. This treatment also results in a
lower ratio of net charge-offs to average loans. See Note 6
Purchased Loans in the Notes To Consolidated Financial
Statements in Item 8 of this Report for additional information
on net charge-offs related to these loans.
We maintain an ALLL to absorb losses from the loan and
lease portfolio and determine this allowance based on
quarterly assessments of the estimated probable credit losses
incurred in the loan and lease portfolio. We maintain the
ALLL at a level that we believe to be appropriate to absorb
estimated probable credit losses incurred in the loan and lease
82 The PNC Financial Services Group, Inc. – Form 10-K