PNC Bank 2013 Annual Report Download - page 54
Download and view the complete annual report
Please find page 54 of the 2013 PNC Bank annual report below. You can navigate through the pages in the report by either clicking on the pages listed below, or by using the keyword search tool below to find specific information within the annual report.-
 1
1 -
2
-
3
-
4
-
5
-
6
-
7
-
8
-
9
-
10
-
11
-
12
-
13
-
14
-
15
-
16
-
17
-
18
-
19
-
20
-
21
-
22
-
23
-
24
-
25
-
26
-
27
-
28
-
29
-
30
-
31
-
32
-
33
-
34
-
35
-
36
-
37
-
38
-
39
-
40
-
41
-
42
-
43
-
 44
44 -
 45
45 -
 46
46 -
 47
47 -
 48
48 -
 49
49 -
 50
50 -
 51
51 -
 52
52 -
 53
53 -
 54
54 -
 55
55 -
 56
56 -
 57
57 -
 58
58 -
 59
59 -
 60
60 -
 61
61 -
 62
62 -
 63
63 -
 64
64 -
65
-
66
-
67
-
68
-
69
-
70
-
71
-
72
-
73
-
74
-
75
-
76
-
77
-
78
-
79
-
80
-
81
-
82
-
83
-
84
-
85
-
86
-
87
-
88
-
89
-
90
-
91
-
92
-
93
-
94
-
95
-
96
-
97
-
98
-
99
-
100
-
101
-
102
-
103
-
104
-
105
-
106
-
107
-
108
-
109
-
110
-
111
-
112
-
113
-
114
-
115
-
116
-
117
-
118
-
119
-
120
-
121
-
122
-
123
-
124
-
125
-
126
-
127
-
128
-
129
-
130
-
131
-
132
-
133
-
134
-
135
-
136
-
137
-
138
-
139
-
140
-
141
-
142
-
143
-
144
-
145
-
146
-
147
-
148
-
149
-
150
-
151
-
152
-
153
-
154
-
155
-
156
-
157
-
158
-
159
-
160
-
161
-
162
-
163
-
164
-
165
-
166
-
167
-
168
-
169
-
170
-
171
-
172
-
173
-
174
-
175
-
176
-
177
-
178
-
179
-
180
-
181
-
182
-
183
-
184
-
185
-
186
-
187
-
188
-
189
-
190
-
191
-
192
-
193
-
194
-
195
-
196
-
197
-
198
-
199
-
200
-
201
-
202
-
203
-
204
-
205
-
206
-
207
-
208
-
209
-
210
-
211
-
212
-
213
-
214
-
215
-
216
-
217
-
218
-
219
-
220
-
221
-
222
-
223
-
224
-
225
-
226
-
227
-
228
-
229
-
230
-
231
-
232
-
233
-
234
-
235
-
236
-
237
-
238
-
239
-
240
-
241
-
242
-
243
-
244
-
245
-
246
-
247
-
248
-
249
-
250
-
251
-
252
-
253
-
254
-
255
-
256
-
257
-
258
-
259
-
260
-
261
-
262
-
263
-
264
-
265
-
266
 |
 |

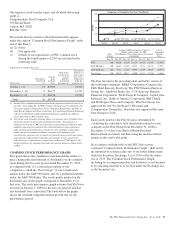
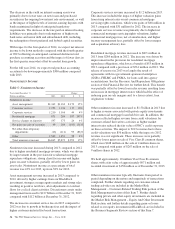
The decrease in the yield on interest-earning assets was
primarily due to lower rates on new loans and purchased
securities in the ongoing low interest rate environment, as well
as the impact of higher levels of interest-earning deposits with
banks maintained in light of anticipated regulatory
requirements. The decrease in the rate paid on interest-bearing
liabilities was primarily due to redemptions of higher-rate
bank notes and senior debt and subordinated debt, including
the redemption of trust preferred and hybrid capital securities.
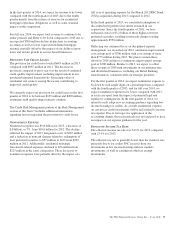
With respect to the first quarter of 2014, we expect net interest
income to be down modestly compared with the fourth quarter
of 2013 reflecting an anticipated continued decline in total
purchase accounting accretion and the impact of fewer days in
the first quarter somewhat offset by modest loan growth.
For the full year 2014, we expect total purchase accounting
accretion to be down approximately $300 million compared
with 2013.
N
ONINTEREST
I
NCOME
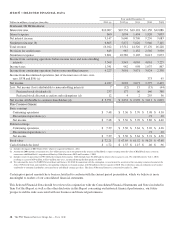
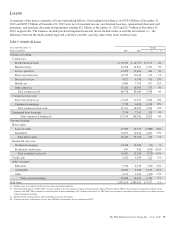
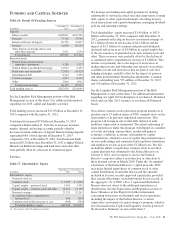
Table 5: Noninterest Income
Year ended December 31 Change
Dollars in millions 2013 2012 $ %
Noninterest income
Asset management $1,342 $1,169 $ 173 15%
Consumer services 1,253 1,136 117 10%
Corporate services 1,210 1,166 44 4%
Residential mortgage 871 284 587 207%
Service charges on deposits 597 573 24 4%
Net gains on sales of securities 99 204 (105) (51)%
Net other-than-temporary
impairments (16) (111) 95 (86)%
Other 1,509 1,451 58 4%
Total noninterest income $6,865 $5,872 $ 993 17%
Noninterest income increased during 2013 compared to 2012
due to higher residential mortgage revenue, which was driven
by improvement in the provision for residential mortgage
repurchase obligations, strong client fee income and higher
gains on asset valuations, partially offset by lower gains on
asset sales. Noninterest income as a percentage of total
revenue was 43% for 2013, up from 38% for 2012.
Asset management revenue increased in 2013 compared to
2012, driven by higher earnings from our BlackRock
investment, stronger average equity markets and strong sales
resulting in positive net flows, after adjustments to total net
flows for cyclical client activities. Discretionary assets under
management increased to $127 billion at December 31, 2013
compared with $112 billion at December 31, 2012.
The increase in consumer service fees in 2013 compared to
2012 was due to growth in brokerage fees and the impact of
higher customer-initiated fee based transactions.
Corporate services revenue increased to $1.2 billion in 2013.
This increase included the impact of higher valuation gains
from rising interest rates on net commercial mortgage
servicing rights valuations, which were gains of $68 million in
2013 compared with $31 million for 2012. The increase in
corporate services revenue was primarily due to higher net
commercial mortgage servicing rights valuations, higher
commercial mortgage fees, net of amortization, and higher
treasury management fees, partially offset by lower merger
and acquisition advisory fees.
Residential mortgage revenue increased to $871 million in
2013 from $284 million in 2012. The increase was driven by
improvement in the provision for residential mortgage
repurchase obligations, which was a benefit of $53 million in
2013 compared with a provision of $761 million in 2012. The
release of reserves in 2013 was largely the result of
agreements with two government-sponsored enterprises
(GSEs), FHLMC and FNMA, for loans sold into agency
securitizations. See the Recourse And Repurchase Obligations
section of this Financial Review for further detail. This benefit
was partially offset by lower loan sales revenue resulting from
an increase in mortgage interest rates which had the effect of
reducing gain on sale margins and, to a lesser extent, loan
origination volume.
Other noninterest income increased to $1.5 billion in 2013 due
to higher revenue associated with private equity investments
and commercial mortgage loans held for sale. In addition, the
increase reflected higher revenue from credit valuations for
customer-related derivatives activities as higher market
interest rates reduced the fair value of PNC’s credit exposure
on these activities. The impact to 2013 revenue due to these
credit valuations was $56 million, while the impact to 2012
revenue was not significant. These increases were partially
offset by lower gains on sale of Visa Class B common shares,
which were $168 million on the sale of 4 million shares in
2013 compared with gains of $267 million on the sale of
9 million shares in 2012.
We held approximately 10 million Visa Class B common
shares with a fair value of approximately $971 million and
recorded investment of $158 million as of December 31, 2013.
Other noninterest income typically fluctuates from period to
period depending on the nature and magnitude of transactions
completed. Further details regarding our customer-related
trading activities are included in the Market Risk
Management – Customer-Related Trading Risk portion of the
Risk Management section of this Item 7. Further details
regarding private and other equity investments are included in
the Market Risk Management – Equity And Other Investment
Risk section, and further details regarding gains or losses
related to our equity investment in BlackRock are included in
the Business Segments Review section of this Item 7.
36 The PNC Financial Services Group, Inc. – Form 10-K