NVIDIA 2015 Annual Report Download - page 168
Download and view the complete annual report
Please find page 168 of the 2015 NVIDIA annual report below. You can navigate through the pages in the report by either clicking on the pages listed below, or by using the keyword search tool below to find specific information within the annual report.-
 1
1 -
2
-
3
-
4
-
5
-
6
-
7
-
8
-
9
-
10
-
11
-
12
-
13
-
14
-
15
-
16
-
17
-
18
-
19
-
20
-
21
-
22
-
23
-
24
-
25
-
26
-
27
-
28
-
29
-
30
-
31
-
32
-
33
-
34
-
35
-
36
-
37
-
38
-
39
-
40
-
41
-
42
-
43
-
44
-
45
-
46
-
47
-
48
-
49
-
50
-
51
-
52
-
53
-
54
-
55
-
56
-
57
-
58
-
59
-
60
-
61
-
62
-
63
-
64
-
65
-
66
-
67
-
68
-
69
-
70
-
71
-
72
-
73
-
74
-
75
-
76
-
77
-
78
-
79
-
80
-
81
-
82
-
83
-
84
-
85
-
86
-
87
-
88
-
89
-
90
-
91
-
92
-
93
-
94
-
95
-
96
-
97
-
98
-
99
-
100
-
101
-
102
-
103
-
104
-
105
-
106
-
107
-
108
-
109
-
110
-
111
-
112
-
113
-
114
-
115
-
116
-
117
-
118
-
119
-
120
-
121
-
122
-
123
-
124
-
125
-
126
-
127
-
128
-
129
-
130
-
131
-
132
-
133
-
134
-
135
-
136
-
137
-
138
-
139
-
140
-
141
-
142
-
143
-
144
-
145
-
146
-
147
-
148
-
149
-
150
-
151
-
152
-
153
-
154
-
155
-
156
-
157
-
 158
158 -
 159
159 -
 160
160 -
 161
161 -
 162
162 -
 163
163 -
 164
164 -
 165
165 -
 166
166 -
 167
167 -
 168
168 -
 169
169 -
 170
170 -
 171
171 -
 172
172 -
 173
173 -
 174
174 -
 175
175 -
 176
176 -
 177
177 -
 178
178 -
179
-
180
-
181
-
182
-
183
 |
 |

NVIDIA CORPORATION AND SUBSIDIARIES
NOTES TO THE CONSOLIDATED FINANCIAL STATEMENTS
(Continued)
88
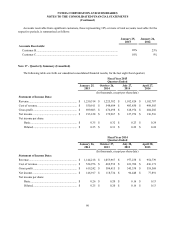
those expenses to the reporting segment that benefits the most. The revenue and cost of revenue of the reporting segments
was not affected, and comparative periods presented below reflect the impact of this change.
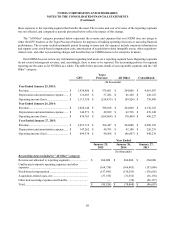
The “All Other” category presented below represents the revenue and expenses that our CODM does not assign to
either the GPU business or the Tegra Processor business for purposes of making operating decisions or assessing financial
performance. The revenue includes primarily patent licensing revenue and the expenses include corporate infrastructure
and support costs, stock-based compensation costs, amortization of acquisition-related intangible assets, other acquisition-
related costs, and other non-recurring charges and benefits that our CODM deems to be enterprise in nature.
Our CODM does not review any information regarding total assets on a reporting segment basis. Reporting segments
do not record intersegment revenue, and, accordingly, there is none to be reported. The accounting policies for segment
reporting are the same as for NVIDIA as a whole. The table below presents details of our reportable segments and the “All
Other” category.
GPU Tegra
Processor All Other Consolidated
(In thousands)
Year Ended January 25, 2015:
Revenue ...................................................... $ 3,838,906 $ 578,601 $ 264,000 $ 4,681,507
Depreciation and amortization expense...... $ 116,683 $ 57,282 $ 46,160 $ 220,125
Operating income (loss).............................. $ 1,113,350 $ (254,435) $ (99,926) $ 758,989
Year Ended January 26, 2014:
Revenue ...................................................... $ 3,468,144 $ 398,018 $ 264,000 $ 4,130,162
Depreciation and amortization expense...... $ 146,571 $ 49,839 $ 42,738 $ 239,148
Operating income (loss).............................. $ 834,763 $ (268,068) $ (70,468) $ 496,227
Year Ended January 27, 2013:
Revenue ...................................................... $ 3,251,712 $ 764,447 $ 264,000 $ 4,280,159
Depreciation and amortization expense...... $ 143,262 $ 40,793 $ 42,180 $ 226,235
Operating income (loss).............................. $ 694,338 $ 40,508 $ (86,607) $ 648,239
Year Ended
January 25,
2015 January 26,
2014 January 27,
2013
(In thousands)
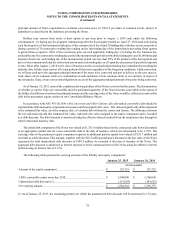
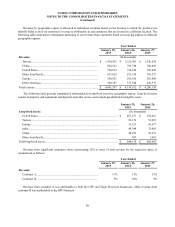
Reconciling items included in "All Other" category:
Revenue not allocated to reporting segments......................... $ 264,000 $ 264,000 $ 264,000
Unallocated corporate operating expenses and other
expenses ................................................................................. (168,730)(166,483)(157,680)
Stock-based compensation..................................................... (157,841)(136,295)(136,662)
Acquisition-related costs, net................................................. (37,355)(31,652)(36,138)
Other non-recurring expenses and benefits............................ —(38)(20,127)
Total........................................................................................ $(99,926) $ (70,468) $ (86,607)