NVIDIA 2015 Annual Report Download - page 147
Download and view the complete annual report
Please find page 147 of the 2015 NVIDIA annual report below. You can navigate through the pages in the report by either clicking on the pages listed below, or by using the keyword search tool below to find specific information within the annual report.-
 1
1 -
2
-
3
-
4
-
5
-
6
-
7
-
8
-
9
-
10
-
11
-
12
-
13
-
14
-
15
-
16
-
17
-
18
-
19
-
20
-
21
-
22
-
23
-
24
-
25
-
26
-
27
-
28
-
29
-
30
-
31
-
32
-
33
-
34
-
35
-
36
-
37
-
38
-
39
-
40
-
41
-
42
-
43
-
44
-
45
-
46
-
47
-
48
-
49
-
50
-
51
-
52
-
53
-
54
-
55
-
56
-
57
-
58
-
59
-
60
-
61
-
62
-
63
-
64
-
65
-
66
-
67
-
68
-
69
-
70
-
71
-
72
-
73
-
74
-
75
-
76
-
77
-
78
-
79
-
80
-
81
-
82
-
83
-
84
-
85
-
86
-
87
-
88
-
89
-
90
-
91
-
92
-
93
-
94
-
95
-
96
-
97
-
98
-
99
-
100
-
101
-
102
-
103
-
104
-
105
-
106
-
107
-
108
-
109
-
110
-
111
-
112
-
113
-
114
-
115
-
116
-
117
-
118
-
119
-
120
-
121
-
122
-
123
-
124
-
125
-
126
-
127
-
128
-
129
-
130
-
131
-
132
-
133
-
134
-
135
-
136
-
 137
137 -
 138
138 -
 139
139 -
 140
140 -
 141
141 -
 142
142 -
 143
143 -
 144
144 -
 145
145 -
 146
146 -
 147
147 -
 148
148 -
 149
149 -
 150
150 -
 151
151 -
 152
152 -
 153
153 -
 154
154 -
 155
155 -
 156
156 -
 157
157 -
158
-
159
-
160
-
161
-
162
-
163
-
164
-
165
-
166
-
167
-
168
-
169
-
170
-
171
-
172
-
173
-
174
-
175
-
176
-
177
-
178
-
179
-
180
-
181
-
182
-
183
 |
 |

NVIDIA CORPORATION AND SUBSIDIARIES
NOTES TO THE CONSOLIDATED FINANCIAL STATEMENTS
(Continued)
67
this percentage at its discretion, up to 15%. The price of common stock purchased under our ESPP will be equal to 85% of
the lower of the fair market value of the common stock on the commencement date of each offering period and the purchase
date of each offering period. Employees may end their participation in the ESPP at any time during the offering period, and
participation ends automatically on termination of employment with us. In each case, the employee’s contributions are
refunded.
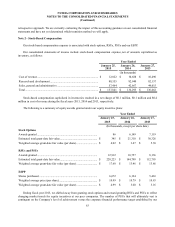
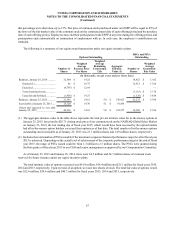
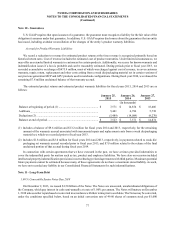
The following is a summary of our equity award transactions under our equity incentive plans:
Options Outstanding RSUs and PSUs
Outstanding
Number of
Shares
Weighted
Average
Exercise Price
Per Share
Weighted
Average
Remaining
Contractual
Life
Aggregate
Intrinsic
Value (1) Number of
Shares
Weighted
Average
Grant-Date
Fair Value
(In thousands, except years and per share data)
Balances, January 26, 2014............. 32,504 $ 14.22 18,852 $ 13.82
Granted (2)................................. 86 $ 18.75 12,912 $ 17.68
Exercised ................................... (9,795) $ 12.64 — —
Vested restricted stock............... — — (7,163) $ 13.78
Canceled and forfeited............... (1,450) $ 19.27 (1,326) $ 14.44
Balances, January 25, 2015............. 21,345 $ 14.61 5.9 $ 130,923 23,275 $ 15.94
Exercisable at January 25, 2015 ..... 15,120 $ 14.70 5.1 $ 91,434
Vested and expected to vest after
January 25, 2015............................. 20,356 $ 14.62 5.8 $ 124,575 18,988 $ 15.96
(1) The aggregate intrinsic value in the table above represents the total pre-tax intrinsic value for in-the-money options at
January 25, 2015, based on the $20.71 closing stock price of our common stock on the NASDAQ Global Select Market
on January 23, 2015, the last trading day of fiscal year 2015, which would have been received by the option holders
had all in-the-money option holders exercised their options as of that date. The total number of in-the-money options
outstanding and exercisable as of January 25, 2015 was 21.1 million shares and 14.9 million shares, respectively.
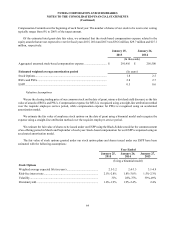
(2) Includes the total number of PSUs issuable if the maximum corporate financial performance target level for fiscal year
2015 is achieved. Depending on the actual level of achievement of the corporate performance target at the end of fiscal
year 2015, the range of PSUs issued could be from 1.3 million to 2.5 million shares. The PSUs were granted during
the first quarter of fiscal year 2015 to our CEO and senior management as approved by our Compensation Committee.
As of January 25, 2015 and January 26, 2014, there were 24.5 million and 24.7 million shares of common stock
reserved for future issuance under our equity incentive plans.
The total intrinsic value of options exercised was $61.9 million, $14.4 million and $21.1 million for fiscal years 2015,
2014 and 2013, respectively. Upon exercise of an option, we issue new shares of stock. The total fair value of options vested
was $32.6 million, $34.6 million and $40.3 million for fiscal years 2015, 2014 and 2013, respectively.