NVIDIA 2015 Annual Report Download - page 118
Download and view the complete annual report
Please find page 118 of the 2015 NVIDIA annual report below. You can navigate through the pages in the report by either clicking on the pages listed below, or by using the keyword search tool below to find specific information within the annual report.-
 1
1 -
2
-
3
-
4
-
5
-
6
-
7
-
8
-
9
-
10
-
11
-
12
-
13
-
14
-
15
-
16
-
17
-
18
-
19
-
20
-
21
-
22
-
23
-
24
-
25
-
26
-
27
-
28
-
29
-
30
-
31
-
32
-
33
-
34
-
35
-
36
-
37
-
38
-
39
-
40
-
41
-
42
-
43
-
44
-
45
-
46
-
47
-
48
-
49
-
50
-
51
-
52
-
53
-
54
-
55
-
56
-
57
-
58
-
59
-
60
-
61
-
62
-
63
-
64
-
65
-
66
-
67
-
68
-
69
-
70
-
71
-
72
-
73
-
74
-
75
-
76
-
77
-
78
-
79
-
80
-
81
-
82
-
83
-
84
-
85
-
86
-
87
-
88
-
89
-
90
-
91
-
92
-
93
-
94
-
95
-
96
-
97
-
98
-
99
-
100
-
101
-
102
-
103
-
104
-
105
-
106
-
107
-
 108
108 -
 109
109 -
 110
110 -
 111
111 -
 112
112 -
 113
113 -
 114
114 -
 115
115 -
 116
116 -
 117
117 -
 118
118 -
 119
119 -
 120
120 -
 121
121 -
 122
122 -
 123
123 -
 124
124 -
 125
125 -
 126
126 -
 127
127 -
 128
128 -
129
-
130
-
131
-
132
-
133
-
134
-
135
-
136
-
137
-
138
-
139
-
140
-
141
-
142
-
143
-
144
-
145
-
146
-
147
-
148
-
149
-
150
-
151
-
152
-
153
-
154
-
155
-
156
-
157
-
158
-
159
-
160
-
161
-
162
-
163
-
164
-
165
-
166
-
167
-
168
-
169
-
170
-
171
-
172
-
173
-
174
-
175
-
176
-
177
-
178
-
179
-
180
-
181
-
182
-
183
 |
 |

38
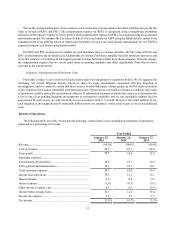
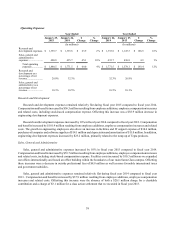
Operating Expenses
Year Ended Year Ended
January 25,
2015 January 26,
2014 $
Change %
Change January 26,
2014 January 27,
2013 $
Change %
Change
(In millions) (In millions)
Research and
development expenses.$ 1,359.7 $ 1,335.8 $ 23.9 2% $ 1,335.8 $ 1,147.3 $ 188.5 16%
Sales, general and
administrative
expenses ...................... 480.8 435.7 45.1 10% 435.7 430.8 4.9 1%
Total operating
expenses................. $ 1,840.5 $ 1,771.5 $ 69.0 4% $ 1,771.5 $ 1,578.1 $ 193.4 12%
Research and
development as a
percentage of net
revenue ........................ 29.0% 32.3% 32.3% 26.8%
Sales, general and
administrative as a
percentage of net
revenue ........................ 10.3% 10.5% 10.5% 10.1%
Research and Development
Research and development expenses remained relatively flat during fiscal year 2015 compared to fiscal year 2014.
Compensation and benefits increased by $56.5 million resulting from employee additions, employee compensation increases
and related costs, including stock-based compensation expense. Offsetting this increase was a $38.9 million decrease in
engineering development expenses.
Research and development expenses increased by 16% in fiscal year 2014 compared to fiscal year 2013. Compensation
and benefits increased by $101.9 million resulting from employee additions, employee compensation increases and related
costs. The growth in engineering employees also drove an increase in facilities and IT support expense of $34.6 million,
purchases of computer and software supplies of $14.1 million and depreciation and amortization of $11.0 million. In addition,
engineering development expenses increased by $23.2 million, primarily related to the ramp up of Tegra products.
Sales, General and Administrative
Sales, general and administrative expenses increased by 10% in fiscal year 2015 compared to fiscal year 2014.
Compensation and benefits increased by $53.7 million resulting from employee additions, employee compensation increases
and related costs, including stock-based compensation expense. Facilities costs increased by $10.3 million as we expanded
our offices internationally and leased an office building within the boundaries of our main Santa Clara campus. Offsetting
these increases were a decrease in outside professional fees of $8.8 million as well as more favorable international taxes
and government subsidies.
Sales, general and administrative expenses remained relatively flat during fiscal year 2014 compared to fiscal year
2013. Compensation and benefits increased by $37.9 million resulting from employee additions, employee compensation
increases and related costs. Offsetting this increase were the absence of both a $20.1 million charge for a charitable
contribution and a charge of $3.1 million for a class action settlement that we recorded in fiscal year 2013.