NVIDIA 2015 Annual Report Download - page 155
Download and view the complete annual report
Please find page 155 of the 2015 NVIDIA annual report below. You can navigate through the pages in the report by either clicking on the pages listed below, or by using the keyword search tool below to find specific information within the annual report.-
 1
1 -
2
-
3
-
4
-
5
-
6
-
7
-
8
-
9
-
10
-
11
-
12
-
13
-
14
-
15
-
16
-
17
-
18
-
19
-
20
-
21
-
22
-
23
-
24
-
25
-
26
-
27
-
28
-
29
-
30
-
31
-
32
-
33
-
34
-
35
-
36
-
37
-
38
-
39
-
40
-
41
-
42
-
43
-
44
-
45
-
46
-
47
-
48
-
49
-
50
-
51
-
52
-
53
-
54
-
55
-
56
-
57
-
58
-
59
-
60
-
61
-
62
-
63
-
64
-
65
-
66
-
67
-
68
-
69
-
70
-
71
-
72
-
73
-
74
-
75
-
76
-
77
-
78
-
79
-
80
-
81
-
82
-
83
-
84
-
85
-
86
-
87
-
88
-
89
-
90
-
91
-
92
-
93
-
94
-
95
-
96
-
97
-
98
-
99
-
100
-
101
-
102
-
103
-
104
-
105
-
106
-
107
-
108
-
109
-
110
-
111
-
112
-
113
-
114
-
115
-
116
-
117
-
118
-
119
-
120
-
121
-
122
-
123
-
124
-
125
-
126
-
127
-
128
-
129
-
130
-
131
-
132
-
133
-
134
-
135
-
136
-
137
-
138
-
139
-
140
-
141
-
142
-
143
-
144
-
 145
145 -
 146
146 -
 147
147 -
 148
148 -
 149
149 -
 150
150 -
 151
151 -
 152
152 -
 153
153 -
 154
154 -
 155
155 -
 156
156 -
 157
157 -
 158
158 -
 159
159 -
 160
160 -
 161
161 -
 162
162 -
 163
163 -
 164
164 -
 165
165 -
166
-
167
-
168
-
169
-
170
-
171
-
172
-
173
-
174
-
175
-
176
-
177
-
178
-
179
-
180
-
181
-
182
-
183
 |
 |

NVIDIA CORPORATION AND SUBSIDIARIES
NOTES TO THE CONSOLIDATED FINANCIAL STATEMENTS
(Continued)
75
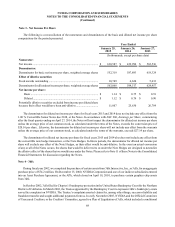
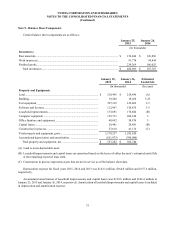
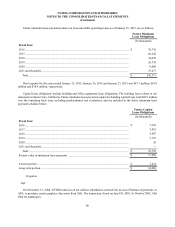
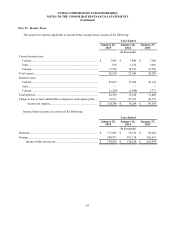
Note 9 - Balance Sheet Components
Certain balance sheet components are as follows:
January 25,
2015 January 26,
2014
(In thousands)
Inventories:
Raw materials................................................................................................................... $ 156,846 $ 126,896
Work in-process................................................................................................................ 91,778 94,844
Finished goods.................................................................................................................. 234,269 166,025
Total inventories.......................................................................................................... $ 482,893 $ 387,765
January 25,
2015 January 26,
2014 Estimated
Useful Life
(In thousands) (In years)
Property and Equipment:
Land...................................................................................................... $ 218,496 $ 218,496 (A)
Building ................................................................................................ 19,268 19,268 5-25
Test equipment...................................................................................... 397,319 412,862 3-5
Software and licenses ........................................................................... 112,967 120,435 3-5
Leasehold improvements...................................................................... 173,691 178,884 (B)
Computer equipment ............................................................................ 152,733 204,344 3
Office furniture and equipment............................................................. 48,692 58,874 5
Capital leases ........................................................................................ 28,481 28,481 (B)
Construction in process......................................................................... 27,610 41,176 (C)
Total property and equipment, gross .................................................... 1,179,257 1,282,820
Accumulated depreciation and amortization ........................................ (621,975)(700,080)
Total property and equipment, net................................................... $ 557,282 $ 582,740
(A) Land is a non-depreciable asset.
(B) Leasehold improvements and capital leases are amortized based on the lesser of either the asset’s estimated useful life
or the remaining expected lease term.
(C) Construction in process represents assets that are not in service as of the balance sheet date.
Depreciation expense for fiscal years 2015, 2014 and 2013 was $143.1 million, $164.0 million and $157.6 million,
respectively.
Accumulated amortization of leasehold improvements and capital leases was $139.6 million and $146.4 million at
January 25, 2015 and January 26, 2014, respectively. Amortization of leasehold improvements and capital leases is included
in depreciation and amortization expense.