NVIDIA 2015 Annual Report Download - page 153
Download and view the complete annual report
Please find page 153 of the 2015 NVIDIA annual report below. You can navigate through the pages in the report by either clicking on the pages listed below, or by using the keyword search tool below to find specific information within the annual report.-
 1
1 -
2
-
3
-
4
-
5
-
6
-
7
-
8
-
9
-
10
-
11
-
12
-
13
-
14
-
15
-
16
-
17
-
18
-
19
-
20
-
21
-
22
-
23
-
24
-
25
-
26
-
27
-
28
-
29
-
30
-
31
-
32
-
33
-
34
-
35
-
36
-
37
-
38
-
39
-
40
-
41
-
42
-
43
-
44
-
45
-
46
-
47
-
48
-
49
-
50
-
51
-
52
-
53
-
54
-
55
-
56
-
57
-
58
-
59
-
60
-
61
-
62
-
63
-
64
-
65
-
66
-
67
-
68
-
69
-
70
-
71
-
72
-
73
-
74
-
75
-
76
-
77
-
78
-
79
-
80
-
81
-
82
-
83
-
84
-
85
-
86
-
87
-
88
-
89
-
90
-
91
-
92
-
93
-
94
-
95
-
96
-
97
-
98
-
99
-
100
-
101
-
102
-
103
-
104
-
105
-
106
-
107
-
108
-
109
-
110
-
111
-
112
-
113
-
114
-
115
-
116
-
117
-
118
-
119
-
120
-
121
-
122
-
123
-
124
-
125
-
126
-
127
-
128
-
129
-
130
-
131
-
132
-
133
-
134
-
135
-
136
-
137
-
138
-
139
-
140
-
141
-
142
-
 143
143 -
 144
144 -
 145
145 -
 146
146 -
 147
147 -
 148
148 -
 149
149 -
 150
150 -
 151
151 -
 152
152 -
 153
153 -
 154
154 -
 155
155 -
 156
156 -
 157
157 -
 158
158 -
 159
159 -
 160
160 -
 161
161 -
 162
162 -
 163
163 -
164
-
165
-
166
-
167
-
168
-
169
-
170
-
171
-
172
-
173
-
174
-
175
-
176
-
177
-
178
-
179
-
180
-
181
-
182
-
183
 |
 |

NVIDIA CORPORATION AND SUBSIDIARIES
NOTES TO THE CONSOLIDATED FINANCIAL STATEMENTS
(Continued)
73
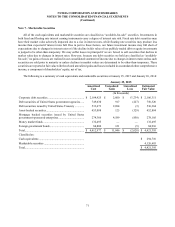
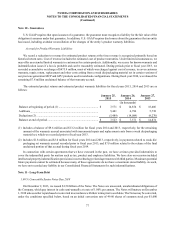
accounting literature, we concluded that our investments were appropriately valued and that no other than temporary
impairment charges were necessary on our portfolio of available for sale investments as of January 25, 2015.
As of January 25, 2015, we had nine investments that were in an unrealized loss position with total unrealized losses
amounting to $2.4 million and with a duration of less than one year. The gross unrealized losses related to fixed income
securities were due to changes in interest rates. We have determined that the gross unrealized losses on investment securities
at January 25, 2015 are temporary in nature. Currently, we have the intent and ability to hold our investments with impairment
indicators until maturity.
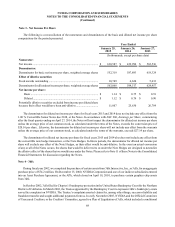
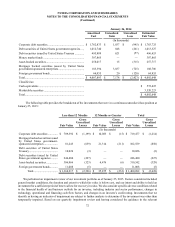
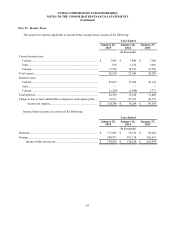
Net realized gains were $0.1 million, $2.4 million and $0.5 million for fiscal years 2015, 2014, and 2013, respectively.
As of January 25, 2015, we had a net unrealized gain of $8.4 million, which was comprised of gross unrealized gains of
$11.0 million, offset by $2.6 million of gross unrealized losses. As of January 26, 2014, we had a net unrealized gain of
$4.8 million, which was comprised of gross unrealized gains of $7.2 million, offset by $2.4 million of gross unrealized
losses.
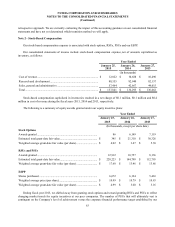
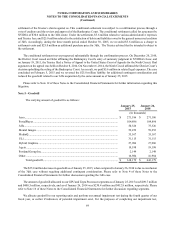
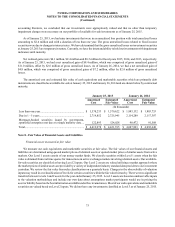
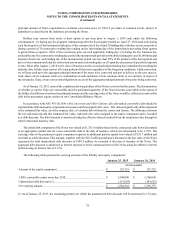
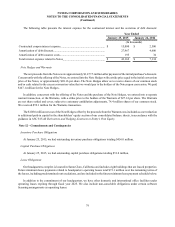
The amortized cost and estimated fair value of cash equivalents and marketable securities which are primarily debt
instruments are classified as available-for-sale at January 25, 2015 and January 26, 2014 and are shown below by contractual
maturity.
January 25, 2015 January 26, 2014
Amortized
Cost Estimated
Fair Value Amortized
Cost Estimated
Fair Value
(In thousands)
Less than one year............................................................. $ 1,570,233 $ 1,570,622 $ 1,883,132 $ 1,883,753
Due in 1 - 5 years.............................................................. 2,719,852 2,725,945 2,114,289 2,117,387
Mortgage-backed securities issued by government-
sponsored enterprises not due at a single maturity date.... 122,893 124,828 90,472 91,508
Total................................................................................... $ 4,412,978 $ 4,421,395 $ 4,087,893 $ 4,092,648
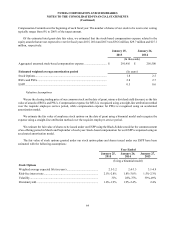
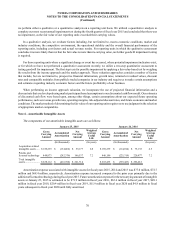
Note 8 - Fair Value of Financial Assets and Liabilities
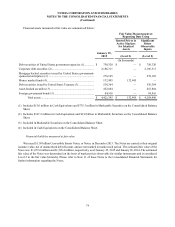
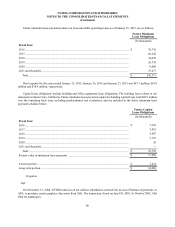
Financial assets measured at fair value
We measure our cash equivalents and marketable securities at fair value. The fair values of our financial assets and
liabilities are determined using quoted market prices of identical assets or quoted market prices of similar assets from active
markets. Our Level 1 assets consist of our money market funds. We classify securities within Level 1 assets when the fair
value is obtained from real time quotes for transactions in active exchange markets involving identical assets. Our available-
for-sale securities are classified as having Level 2 inputs. Our Level 2 assets are valued utilizing a market approach where
the market prices of similar assets are provided by a variety of independent industry standard data providers to our investment
custodian. We review the fair value hierarchy classification on a quarterly basis. Changes in the observability of valuation
inputs may result in a reclassification of levels for certain securities within the fair value hierarchy. There were no significant
transfers between Levels 1 and 2 assets for the year ended January 25, 2015. Level 3 assets are based on unobservable inputs
to the valuation methodology and include our own data about assumptions market participants would use in pricing the
asset or liability based on the best information available under the circumstances. Most of our cash equivalents and marketable
securities are valued based on Level 2 inputs. We did not have any investments classified as Level 3 as of January 25, 2015.