NVIDIA 2015 Annual Report Download - page 143
Download and view the complete annual report
Please find page 143 of the 2015 NVIDIA annual report below. You can navigate through the pages in the report by either clicking on the pages listed below, or by using the keyword search tool below to find specific information within the annual report.-
 1
1 -
2
-
3
-
4
-
5
-
6
-
7
-
8
-
9
-
10
-
11
-
12
-
13
-
14
-
15
-
16
-
17
-
18
-
19
-
20
-
21
-
22
-
23
-
24
-
25
-
26
-
27
-
28
-
29
-
30
-
31
-
32
-
33
-
34
-
35
-
36
-
37
-
38
-
39
-
40
-
41
-
42
-
43
-
44
-
45
-
46
-
47
-
48
-
49
-
50
-
51
-
52
-
53
-
54
-
55
-
56
-
57
-
58
-
59
-
60
-
61
-
62
-
63
-
64
-
65
-
66
-
67
-
68
-
69
-
70
-
71
-
72
-
73
-
74
-
75
-
76
-
77
-
78
-
79
-
80
-
81
-
82
-
83
-
84
-
85
-
86
-
87
-
88
-
89
-
90
-
91
-
92
-
93
-
94
-
95
-
96
-
97
-
98
-
99
-
100
-
101
-
102
-
103
-
104
-
105
-
106
-
107
-
108
-
109
-
110
-
111
-
112
-
113
-
114
-
115
-
116
-
117
-
118
-
119
-
120
-
121
-
122
-
123
-
124
-
125
-
126
-
127
-
128
-
129
-
130
-
131
-
132
-
 133
133 -
 134
134 -
 135
135 -
 136
136 -
 137
137 -
 138
138 -
 139
139 -
 140
140 -
 141
141 -
 142
142 -
 143
143 -
 144
144 -
 145
145 -
 146
146 -
 147
147 -
 148
148 -
 149
149 -
 150
150 -
 151
151 -
 152
152 -
 153
153 -
154
-
155
-
156
-
157
-
158
-
159
-
160
-
161
-
162
-
163
-
164
-
165
-
166
-
167
-
168
-
169
-
170
-
171
-
172
-
173
-
174
-
175
-
176
-
177
-
178
-
179
-
180
-
181
-
182
-
183
 |
 |

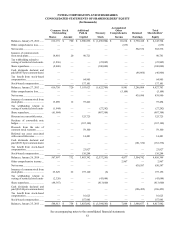
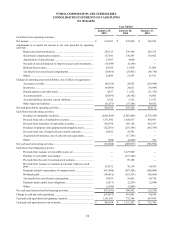
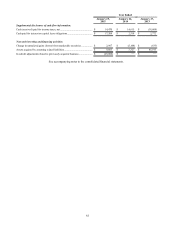
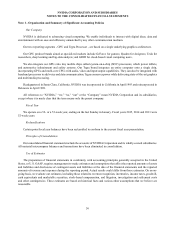
NVIDIA CORPORATION AND SUBSIDIARIES
NOTES TO THE CONSOLIDATED FINANCIAL STATEMENTS
(Continued)
63
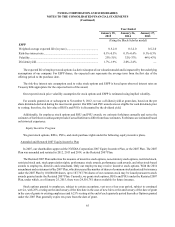
retrospective approach. We are currently evaluating the impact of this accounting guidance on our consolidated financial
statements and have not yet determined which transition method we will apply.
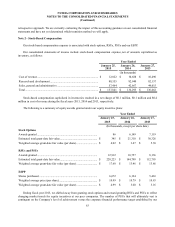
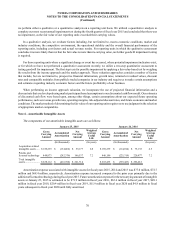
Note 2 - Stock-Based Compensation
Our stock-based compensation expense is associated with stock options, RSUs, PSUs and our ESPP.
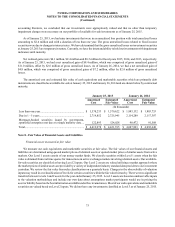
Our consolidated statements of income include stock-based compensation expense, net of amounts capitalized as
inventory, as follows:
Year Ended
January 25,
2015 January 26,
2014 January 27,
2013
(In thousands)
Cost of revenue..................................................................................... $ 12,022 $ 10,688 $ 10,490
Research and development ................................................................... 88,355 82,940 82,157
Sales, general and administrative ......................................................... 57,464 42,667 44,015
Total...................................................................................................... $ 157,841 $ 136,295 $ 136,662
Stock-based compensation capitalized in inventories resulted in a net charge of $0.1 million, $0.1 million and $0.4
million in cost of revenue during the fiscal years 2015, 2014 and 2013, respectively.
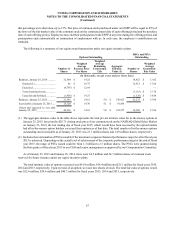
The following is a summary of equity awards granted under our equity incentive plans:
Year Ended
January 25, January 26, January 27,
2015 2014 2013
(In thousands, except per share data)
Stock Options
Awards granted.................................................................................... 86 6,149 7,119
Estimated total grant-date fair value.................................................... $ 345 $ 21,310 $ 38,326
Weighted average grant-date fair value (per share)............................. $ 4.02 $ 3.47 $ 5.38
RSUs and PSUs
Awards granted.................................................................................... 12,912 10,757 8,136
Estimated total grant-date fair value.................................................... $ 228,223 $ 144,798 $ 112,795
Weighted average grant-date fair value (per share)............................. $ 17.68 $ 13.46 $ 13.86
ESPP
Shares purchased.................................................................................. 6,672 6,124 5,463
Weighted average price (per share)...................................................... $ 10.99 $ 10.79 $ 10.83
Weighted average grant-date fair value (per share)............................. $ 4.99 $ 5.60 $ 5.16
During fiscal year 2015, we shifted away from granting stock options and toward granting RSUs and PSUs to reflect
changing market trends for equity incentives at our peer companies. The number of PSUs that will ultimately vest is
contingent on the Company’s level of achievement versus the corporate financial performance target established by our