NVIDIA 2015 Annual Report Download - page 124
Download and view the complete annual report
Please find page 124 of the 2015 NVIDIA annual report below. You can navigate through the pages in the report by either clicking on the pages listed below, or by using the keyword search tool below to find specific information within the annual report.-
 1
1 -
2
-
3
-
4
-
5
-
6
-
7
-
8
-
9
-
10
-
11
-
12
-
13
-
14
-
15
-
16
-
17
-
18
-
19
-
20
-
21
-
22
-
23
-
24
-
25
-
26
-
27
-
28
-
29
-
30
-
31
-
32
-
33
-
34
-
35
-
36
-
37
-
38
-
39
-
40
-
41
-
42
-
43
-
44
-
45
-
46
-
47
-
48
-
49
-
50
-
51
-
52
-
53
-
54
-
55
-
56
-
57
-
58
-
59
-
60
-
61
-
62
-
63
-
64
-
65
-
66
-
67
-
68
-
69
-
70
-
71
-
72
-
73
-
74
-
75
-
76
-
77
-
78
-
79
-
80
-
81
-
82
-
83
-
84
-
85
-
86
-
87
-
88
-
89
-
90
-
91
-
92
-
93
-
94
-
95
-
96
-
97
-
98
-
99
-
100
-
101
-
102
-
103
-
104
-
105
-
106
-
107
-
108
-
109
-
110
-
111
-
112
-
113
-
 114
114 -
 115
115 -
 116
116 -
 117
117 -
 118
118 -
 119
119 -
 120
120 -
 121
121 -
 122
122 -
 123
123 -
 124
124 -
 125
125 -
 126
126 -
 127
127 -
 128
128 -
 129
129 -
 130
130 -
 131
131 -
 132
132 -
 133
133 -
 134
134 -
135
-
136
-
137
-
138
-
139
-
140
-
141
-
142
-
143
-
144
-
145
-
146
-
147
-
148
-
149
-
150
-
151
-
152
-
153
-
154
-
155
-
156
-
157
-
158
-
159
-
160
-
161
-
162
-
163
-
164
-
165
-
166
-
167
-
168
-
169
-
170
-
171
-
172
-
173
-
174
-
175
-
176
-
177
-
178
-
179
-
180
-
181
-
182
-
183
 |
 |
44
ITEM 7A. QUANTITATIVE AND QUALITATIVE DISCLOSURES ABOUT MARKET RISK
Investment and Interest Rate Risk
As of January 25, 2015 and January 26, 2014, we had $4.62 billion and $4.67 billion, respectively, in cash, cash
equivalents and marketable securities. We invest in a variety of financial instruments, consisting principally of cash and
cash equivalents, debt securities of corporations and United States government and its agencies, asset-backed securities,
mortgage-backed securities issued by government-sponsored enterprises, money market funds and foreign government
bonds. As of January 25, 2015, we did not have any investments in auction-rate preferred securities. All of our investments
are denominated in United States dollars.
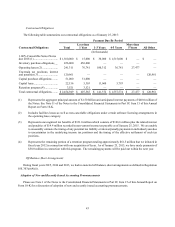
As of January 25, 2015, we performed a sensitivity analysis on our floating and fixed rate financial investments.
According to our analysis, parallel shifts in the yield curve of both plus or minus 0.5% would result in changes in fair values
for these investments of $26 million - $28 million. Please refer to Note 7 of the Notes to the Consolidated Financial Statements
in Part IV, Item 15 of this Annual Report on Form 10-K for additional information.
Other income and expense could also vary materially from expectations depending on gains or losses realized on the
sale or exchange of financial instruments; impairment charges related to debt securities as well as equity and other
investments; interest rates; and cash, cash equivalent and marketable securities balances. Volatility in the financial markets
and economic uncertainty increases the risk that the actual amounts realized in the future on our financial instruments could
differ significantly from the fair values currently assigned to them. As of January 25, 2015, our investments in government
agencies and government sponsored enterprises represented 35% of our total investment portfolio, while the financial sector
accounted for 30% of our total investment portfolio. Substantially all of our investments are with A/A3 or better rated
securities. If the fair value of our investments in these sectors was to decline by 2% - 5%, the fair values of these investments
could decline by approximately $57 million - $144 million.
On December 2, 2013, we issued $1.50 billion of 1.00 % Convertible Senior Notes due 2018, or the Notes. The Notes
are unsecured, unsubordinated obligations of the Company, which pay interest in cash semi-annually at a rate of 1.00% per
annum. We carry the Notes at face value less unamortized discount on our consolidated balance sheets. Since the Notes
bear interest at a fixed rate, we have no financial statement risk associated with changes in interest rates. However, the fair
value of the Notes changes primarily when the market price of our stock fluctuates.
Exchange Rate Risk
We consider our direct exposure to foreign exchange rate fluctuations to be minimal. Gains or losses from foreign
currency remeasurement are included in “Other expense, net” in our Consolidated Financial Statements and to date have
not been significant. The impact of foreign currency transaction gain (loss) included in determining net income for fiscal
years 2015, 2014 and 2013 was $0.5 million, $4.7 million and $(1.5) million, respectively.
Sales and arrangements with third-party manufacturers provide for pricing and payment in United States dollars, and,
therefore, are not subject to exchange rate fluctuations. Increases in the value of the United States’ dollar relative to other
currencies would make our products more expensive, which could negatively impact our ability to compete. Conversely,
decreases in the value of the United States’ dollar relative to other currencies could result in our suppliers raising their prices
in order to continue doing business with us. Additionally, we have international operations and incur expenditures in
currencies other than U.S. dollars. Our operating expenses benefit from a stronger dollar and are adversely affected by a
weaker dollar.
We may enter into certain transactions such as forward contracts which are designed to reduce the future potential
impact resulting from changes in foreign currency exchange rates. There were no forward exchange contracts outstanding
at January 25, 2015.