NVIDIA 2015 Annual Report Download - page 144
Download and view the complete annual report
Please find page 144 of the 2015 NVIDIA annual report below. You can navigate through the pages in the report by either clicking on the pages listed below, or by using the keyword search tool below to find specific information within the annual report.-
 1
1 -
2
-
3
-
4
-
5
-
6
-
7
-
8
-
9
-
10
-
11
-
12
-
13
-
14
-
15
-
16
-
17
-
18
-
19
-
20
-
21
-
22
-
23
-
24
-
25
-
26
-
27
-
28
-
29
-
30
-
31
-
32
-
33
-
34
-
35
-
36
-
37
-
38
-
39
-
40
-
41
-
42
-
43
-
44
-
45
-
46
-
47
-
48
-
49
-
50
-
51
-
52
-
53
-
54
-
55
-
56
-
57
-
58
-
59
-
60
-
61
-
62
-
63
-
64
-
65
-
66
-
67
-
68
-
69
-
70
-
71
-
72
-
73
-
74
-
75
-
76
-
77
-
78
-
79
-
80
-
81
-
82
-
83
-
84
-
85
-
86
-
87
-
88
-
89
-
90
-
91
-
92
-
93
-
94
-
95
-
96
-
97
-
98
-
99
-
100
-
101
-
102
-
103
-
104
-
105
-
106
-
107
-
108
-
109
-
110
-
111
-
112
-
113
-
114
-
115
-
116
-
117
-
118
-
119
-
120
-
121
-
122
-
123
-
124
-
125
-
126
-
127
-
128
-
129
-
130
-
131
-
132
-
133
-
 134
134 -
 135
135 -
 136
136 -
 137
137 -
 138
138 -
 139
139 -
 140
140 -
 141
141 -
 142
142 -
 143
143 -
 144
144 -
 145
145 -
 146
146 -
 147
147 -
 148
148 -
 149
149 -
 150
150 -
 151
151 -
 152
152 -
 153
153 -
 154
154 -
155
-
156
-
157
-
158
-
159
-
160
-
161
-
162
-
163
-
164
-
165
-
166
-
167
-
168
-
169
-
170
-
171
-
172
-
173
-
174
-
175
-
176
-
177
-
178
-
179
-
180
-
181
-
182
-
183
 |
 |

NVIDIA CORPORATION AND SUBSIDIARIES
NOTES TO THE CONSOLIDATED FINANCIAL STATEMENTS
(Continued)
64
Compensation Committee in the beginning of each fiscal year. The number of shares of our stock to be received at vesting
typically ranges from 0% to 200% of the target amount.
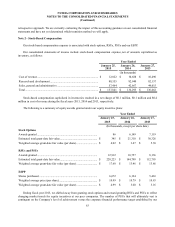
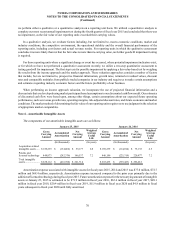
Of the estimated total grant-date fair value, we estimated that the stock-based compensation expense related to the
equity awards that are not expected to vest for fiscal years 2015, 2014 and 2013 was $36.6 million, $29.7 million and $27.1
million, respectively.
January 25, January 26,
2015 2014
(In thousands)
Aggregated unearned stock-based compensation expense ............................... $ 291,416 $ 256,500
Estimated weighted average amortization period (In years)
Stock Options.................................................................................................... 1.8 2.5
RSUs and PSUs................................................................................................. 2.8 2.7
ESPP.................................................................................................................. 0.5 0.6
Valuation Assumptions
We use the closing trading price of our common stock on the date of grant, minus a dividend yield discount, as the fair
value of awards of RSUs and PSUs. Compensation expense for RSUs is recognized using a straight-line attribution method
over the requisite employee service period, while compensation expense for PSUs is recognized using an accelerated
amortization model.
We estimate the fair value of employee stock options on the date of grant using a binomial model and recognize the
expense using a straight-line attribution method over the requisite employee service period.
We estimate the fair value of shares to be issued under our ESPP using the Black-Scholes model at the commencement
of an offering period in March and September of each year. Stock-based compensation for our ESPP is expensed using an
accelerated amortization model.
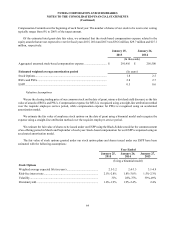
The fair value of stock options granted under our stock option plans and shares issued under our ESPP have been
estimated with the following assumptions:
Year Ended
January 25,
2015 January 26,
2014 January 27,
2013
(Using a binomial model)
Stock Options
Weighted average expected life (in years)............................................ 2.5-3.2 2.4-3.5 3.1-4.9
Risk-free interest rate............................................................................ 2.5%-2.8% 1.8%-3.0% 1.5%-2.3%
Volatility ............................................................................................... 31% 28%-37% 39%-49%
Dividend yield ...................................................................................... 1.8%-1.9% 1.9%-2.4% 2.4%