NVIDIA 2015 Annual Report Download - page 120
Download and view the complete annual report
Please find page 120 of the 2015 NVIDIA annual report below. You can navigate through the pages in the report by either clicking on the pages listed below, or by using the keyword search tool below to find specific information within the annual report.-
 1
1 -
2
-
3
-
4
-
5
-
6
-
7
-
8
-
9
-
10
-
11
-
12
-
13
-
14
-
15
-
16
-
17
-
18
-
19
-
20
-
21
-
22
-
23
-
24
-
25
-
26
-
27
-
28
-
29
-
30
-
31
-
32
-
33
-
34
-
35
-
36
-
37
-
38
-
39
-
40
-
41
-
42
-
43
-
44
-
45
-
46
-
47
-
48
-
49
-
50
-
51
-
52
-
53
-
54
-
55
-
56
-
57
-
58
-
59
-
60
-
61
-
62
-
63
-
64
-
65
-
66
-
67
-
68
-
69
-
70
-
71
-
72
-
73
-
74
-
75
-
76
-
77
-
78
-
79
-
80
-
81
-
82
-
83
-
84
-
85
-
86
-
87
-
88
-
89
-
90
-
91
-
92
-
93
-
94
-
95
-
96
-
97
-
98
-
99
-
100
-
101
-
102
-
103
-
104
-
105
-
106
-
107
-
108
-
109
-
 110
110 -
 111
111 -
 112
112 -
 113
113 -
 114
114 -
 115
115 -
 116
116 -
 117
117 -
 118
118 -
 119
119 -
 120
120 -
 121
121 -
 122
122 -
 123
123 -
 124
124 -
 125
125 -
 126
126 -
 127
127 -
 128
128 -
 129
129 -
 130
130 -
131
-
132
-
133
-
134
-
135
-
136
-
137
-
138
-
139
-
140
-
141
-
142
-
143
-
144
-
145
-
146
-
147
-
148
-
149
-
150
-
151
-
152
-
153
-
154
-
155
-
156
-
157
-
158
-
159
-
160
-
161
-
162
-
163
-
164
-
165
-
166
-
167
-
168
-
169
-
170
-
171
-
172
-
173
-
174
-
175
-
176
-
177
-
178
-
179
-
180
-
181
-
182
-
183
 |
 |

40
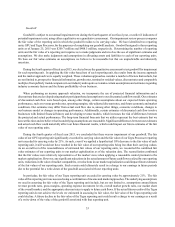
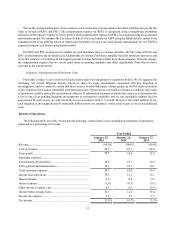
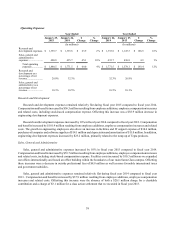
Liquidity and Capital Resources
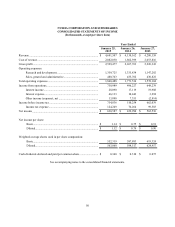
January 25,
2015 January 26,
2014
(In millions)
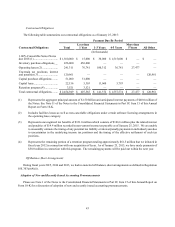
Cash and cash equivalents................................................................................................ $ 496.7 $ 1,151.6
Marketable securities........................................................................................................ 4,126.7 3,520.2
Cash, cash equivalents, and marketable securities........................................................... $ 4,623.4 $ 4,671.8
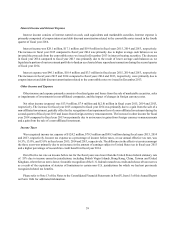
Year Ended
January 25,
2015 January 26,
2014 January 27,
2013
(In millions)
Net cash provided by operating activities............................................. $ 905.7 $ 835.1 $ 824.2
Net cash (used in) investing activities .................................................. $(727.0) $ (805.9) $ (744.0)
Net cash (used in) provided by financing activities.............................. $(833.5) $ 389.6 $ (15.3)
As of January 25, 2015, we had $4.62 billion in cash, cash equivalents and marketable securities, a decrease of $48.5
million from the end of fiscal year 2014. Our portfolio of cash equivalents and marketable securities is managed on our
behalf by several financial institutions which are required to follow our investment policy, which requires the purchase of
high grade investment securities, the diversification of asset types and includes certain limits on our portfolio duration.
Cash provided by operating activities increased in fiscal year 2015 compared to fiscal year 2014 primarily due to higher
net income from revenue growth and contained operating expenses, partially offset by an increase in inventories resulting
from the introduction of newly launched Maxwell-based GPUs and certain Tegra SOCs and SHIELD devices, and an increase
in accounts receivable. Cash provided by operating activities increased slightly in fiscal year 2014 compared to fiscal year
2013 primarily due to a decrease in operating assets offset by a decrease in net income. The decrease in operating assets
was driven mainly by a combination of a decrease in accounts receivable, resulting from strong collections and linear
monthly shipments in the fourth quarter of fiscal year 2014, and a decrease in inventories.
Cash used in investing activities for fiscal year 2015 decreased from fiscal year 2014 primarily due to lower purchases
of property and equipment and intangible assets. Cash used in investing activities for fiscal year 2014 increased from fiscal
year 2013 driven primarily by capital expenditures in fiscal year 2014 for new technology licenses and leasehold
improvements at our facilities in various locations.
Cash used in financing activities in fiscal year 2015 resulted primarily from our repurchase of $813.6 million of shares
of our common stock and our cash dividend payments totaling $186.5 million. These uses of cash were offset by cash
proceeds of $153.5 million from common stock issued under our employee stock plans. Cash provided by financing activities
increased in fiscal year 2014 due primarily to the net proceeds of $1.48 billion we received from the convertible note offering
that was completed during the fourth quarter of fiscal year 2014, as well as cash proceeds of $70.2 million from common
stock issued under our employee stock plans. Concurrent with the convertible note offering, we used net proceeds of $108.0
million to fund the related note hedge and warrant transactions. During fiscal year 2014, we also used $887.3 million to
repurchase shares of our common stock and paid $181.3 million of cash dividends to shareholders.
Liquidity
Our primary source of liquidity is cash generated by our operations. Our investment portfolio consists principally of
cash and cash equivalents, debt securities of corporations and United States government and its agencies, asset-backed
securities, mortgage-backed securities issued by government-sponsored enterprises, money market funds and foreign