NVIDIA 2015 Annual Report Download - page 116
Download and view the complete annual report
Please find page 116 of the 2015 NVIDIA annual report below. You can navigate through the pages in the report by either clicking on the pages listed below, or by using the keyword search tool below to find specific information within the annual report.-
 1
1 -
2
-
3
-
4
-
5
-
6
-
7
-
8
-
9
-
10
-
11
-
12
-
13
-
14
-
15
-
16
-
17
-
18
-
19
-
20
-
21
-
22
-
23
-
24
-
25
-
26
-
27
-
28
-
29
-
30
-
31
-
32
-
33
-
34
-
35
-
36
-
37
-
38
-
39
-
40
-
41
-
42
-
43
-
44
-
45
-
46
-
47
-
48
-
49
-
50
-
51
-
52
-
53
-
54
-
55
-
56
-
57
-
58
-
59
-
60
-
61
-
62
-
63
-
64
-
65
-
66
-
67
-
68
-
69
-
70
-
71
-
72
-
73
-
74
-
75
-
76
-
77
-
78
-
79
-
80
-
81
-
82
-
83
-
84
-
85
-
86
-
87
-
88
-
89
-
90
-
91
-
92
-
93
-
94
-
95
-
96
-
97
-
98
-
99
-
100
-
101
-
102
-
103
-
104
-
105
-
 106
106 -
 107
107 -
 108
108 -
 109
109 -
 110
110 -
 111
111 -
 112
112 -
 113
113 -
 114
114 -
 115
115 -
 116
116 -
 117
117 -
 118
118 -
 119
119 -
 120
120 -
 121
121 -
 122
122 -
 123
123 -
 124
124 -
 125
125 -
 126
126 -
127
-
128
-
129
-
130
-
131
-
132
-
133
-
134
-
135
-
136
-
137
-
138
-
139
-
140
-
141
-
142
-
143
-
144
-
145
-
146
-
147
-
148
-
149
-
150
-
151
-
152
-
153
-
154
-
155
-
156
-
157
-
158
-
159
-
160
-
161
-
162
-
163
-
164
-
165
-
166
-
167
-
168
-
169
-
170
-
171
-
172
-
173
-
174
-
175
-
176
-
177
-
178
-
179
-
180
-
181
-
182
-
183
 |
 |

36
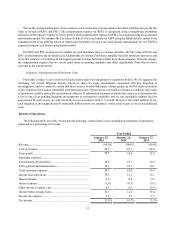
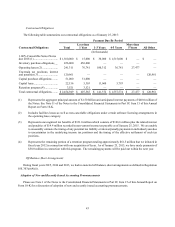
Revenue
Year Ended Year Ended
January 25,
2015 January 26,
2014 $
Change %
Change January 26,
2014 January 27,
2013 $
Change %
Change
(In millions) (In millions)
GPU ......................... $3,838.9 $3,468.1 $370.8 11% $3,468.1 $3,251.7 $216.4 7 %
Tegra Processor........ 578.6 398.0 180.6 45% 398.0 764.4 (366.4) (48)%
All Other.................. 264.0 264.0 — —% 264.0 264.0 — — %
Total......................... $4,681.5 $4,130.1 $551.4 13% $4,130.1 $4,280.1 $(150.0) (4)%
Revenue was $4.68 billion, $4.13 billion and $4.28 billion for fiscal years 2015, 2014 and 2013, respectively. A
discussion of our revenue results for each of our reporting segments and the All Other category is as follows:
GPU Business. GPU business revenue increased by 11% in fiscal year 2015 compared to fiscal year 2014. This increase
was due primarily to higher revenue from GeForce GTX GPUs and associated memory for gaming, reflecting a combination
of continued strength in PC gaming and increased sales of our Maxwell-based GPU products. Revenue from Tesla for
accelerated datacenter computing increased due to large project wins with cloud service providers and revenue from our
NVIDIA GRID virtualization products also increased as this platform gained momentum. Revenue from GPU products for
mainstream PC OEMs declined compared to last year.
GPU business revenue increased by 7% in fiscal year 2014 compared to fiscal year 2013. This increase was largely
attributable to strength in our high-end GeForce GTX GPUs driven by gaming market segment demand. The GPU business
also benefited from higher sales of Tesla accelerated datacenter computing and Quadro enterprise products in fiscal year
2014. Offsetting these growth areas were declines in the overall market for mainstream desktop PCs and notebooks, which
contributed to lower unit volumes of our mainstream GeForce GPUs.
Tegra Processor Business. Tegra Processor business revenue increased by 45% in fiscal year 2015 compared to fiscal
year 2014. This increase was driven by higher sales of Tegra products serving automotive infotainment systems, smartphones
and tablet devices, and the onset of SHIELD tablet sales in fiscal year 2015.
Tegra Processor business revenue decreased by 48% in fiscal year 2014 compared to fiscal year 2013. This decrease
was primarily due to lower sales of our previous generation Tegra 3-based products for smartphones and tablet devices.
Additionally, sales of our embedded products for entertainment devices and revenue from license fees related to game
consoles also decreased during fiscal year 2014. These decreases were partially offset by increased sales of Tegra 4-based
products for smartphones and tablet devices, as well as for automotive infotainment systems.
All Other. License revenue from the patent cross licensing arrangement we entered into with Intel in January 2011 was
flat at $264.0 million for fiscal years 2015, 2014 and 2013.
Concentration of Revenue
Revenue from sales to customers outside of the United States and Other Americas accounted for 75% of total revenue
for both fiscal years 2015 and 2014, and 74% of total revenue for fiscal year 2013. Revenue by geographic region is allocated
to individual countries based on the location to which the products are initially billed even if the revenue is attributable to
end customers in a different location.