NVIDIA 2015 Annual Report Download - page 152
Download and view the complete annual report
Please find page 152 of the 2015 NVIDIA annual report below. You can navigate through the pages in the report by either clicking on the pages listed below, or by using the keyword search tool below to find specific information within the annual report.-
 1
1 -
2
-
3
-
4
-
5
-
6
-
7
-
8
-
9
-
10
-
11
-
12
-
13
-
14
-
15
-
16
-
17
-
18
-
19
-
20
-
21
-
22
-
23
-
24
-
25
-
26
-
27
-
28
-
29
-
30
-
31
-
32
-
33
-
34
-
35
-
36
-
37
-
38
-
39
-
40
-
41
-
42
-
43
-
44
-
45
-
46
-
47
-
48
-
49
-
50
-
51
-
52
-
53
-
54
-
55
-
56
-
57
-
58
-
59
-
60
-
61
-
62
-
63
-
64
-
65
-
66
-
67
-
68
-
69
-
70
-
71
-
72
-
73
-
74
-
75
-
76
-
77
-
78
-
79
-
80
-
81
-
82
-
83
-
84
-
85
-
86
-
87
-
88
-
89
-
90
-
91
-
92
-
93
-
94
-
95
-
96
-
97
-
98
-
99
-
100
-
101
-
102
-
103
-
104
-
105
-
106
-
107
-
108
-
109
-
110
-
111
-
112
-
113
-
114
-
115
-
116
-
117
-
118
-
119
-
120
-
121
-
122
-
123
-
124
-
125
-
126
-
127
-
128
-
129
-
130
-
131
-
132
-
133
-
134
-
135
-
136
-
137
-
138
-
139
-
140
-
141
-
 142
142 -
 143
143 -
 144
144 -
 145
145 -
 146
146 -
 147
147 -
 148
148 -
 149
149 -
 150
150 -
 151
151 -
 152
152 -
 153
153 -
 154
154 -
 155
155 -
 156
156 -
 157
157 -
 158
158 -
 159
159 -
 160
160 -
 161
161 -
 162
162 -
163
-
164
-
165
-
166
-
167
-
168
-
169
-
170
-
171
-
172
-
173
-
174
-
175
-
176
-
177
-
178
-
179
-
180
-
181
-
182
-
183
 |
 |

NVIDIA CORPORATION AND SUBSIDIARIES
NOTES TO THE CONSOLIDATED FINANCIAL STATEMENTS
(Continued)
72
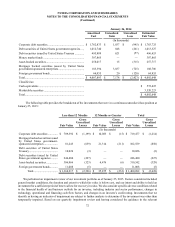
January 26, 2014
Amortized
Cost Unrealized
Gain Unrealized
Loss Estimated
Fair Value
(In thousands)
Corporate debt securities................................................... $ 1,762,833 $ 1,837 $ (945) $ 1,763,725
Debt securities of United States government agencies ..... 1,012,740 848 (261) 1,013,327
Debt securities issued by United States Treasury ............. 495,889 621 (57) 496,453
Money market funds ......................................................... 307,865 — — 307,865
Asset-backed securities..................................................... 258,017 15 (315) 257,717
Mortgage backed securities issued by United States
government-sponsored enterprises.................................... 185,594 3,837 (725) 188,706
Foreign government bonds................................................ 64,955 20 (120) 64,855
Total................................................................................... $ 4,087,893 $ 7,178 $ (2,423) $ 4,092,648
Classified as:
Cash equivalents ............................................................... $ 572,425
Marketable securities ........................................................ 3,520,223
Total................................................................................... $ 4,092,648
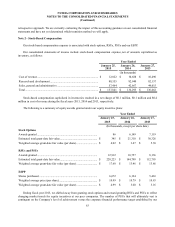
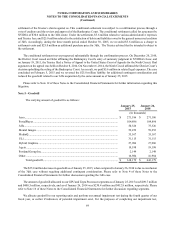
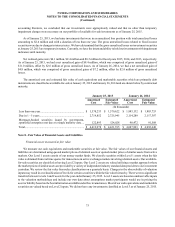
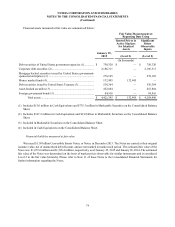
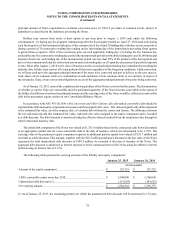
The following table provides the breakdown of the investments that were in a continuous unrealized loss position at
January 25, 2015:
Less than 12 Months 12 Months or Greater Total
Fair Value
Gross
Unrealized
Losses Fair Value
Gross
Unrealized
Losses Fair Value
Gross
Unrealized
Losses
(In thousands)
Corporate debt securities.............. $ 709,392 $ (1,199) $ 10,085 $ (15) $ 719,477 $ (1,214)
Mortgage backed securities issued
by United States government-
sponsored enterprises ................... 81,245 (639) 21,314 (211) 102,559 (850)
Debt securities of United States
Treasury........................................ 10,026 (3) — — 10,026 (3)
Debt securities issued by United
States government agencies ......... 246,480 (227) — — 246,480 (227)
Asset-backed securities ................ 306,066 (323) 4,476 (6) 310,542 (329)
Foreign government bonds........... 11,008 (5) — — 11,008 (5)
Total.................................. $ 1,364,217 $ (2,396) $ 35,875 $ (232) $ 1,400,092 $ (2,628)
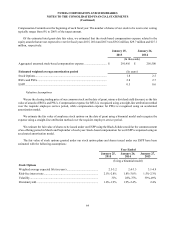
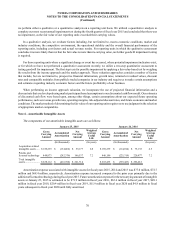
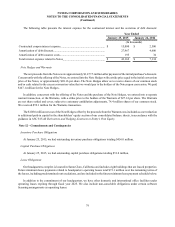
We performed an impairment review of our investment portfolio as of January 25, 2015. Factors considered included
general market conditions, the duration and extent to which fair value is below cost, and our intent and ability to hold an
investment for a sufficient period of time to allow for recovery in value. We also consider specific adverse conditions related
to the financial health of and business outlook for an investee, including industry and sector performance, changes in
technology, operational and financing cash flow factors, and changes in an investee’s credit rating. Investments that we
identify as having an indicator of impairment are subject to further analysis to determine if the investment was other than
temporarily impaired. Based on our quarterly impairment review and having considered the guidance in the relevant