NVIDIA 2015 Annual Report Download - page 117
Download and view the complete annual report
Please find page 117 of the 2015 NVIDIA annual report below. You can navigate through the pages in the report by either clicking on the pages listed below, or by using the keyword search tool below to find specific information within the annual report.-
 1
1 -
2
-
3
-
4
-
5
-
6
-
7
-
8
-
9
-
10
-
11
-
12
-
13
-
14
-
15
-
16
-
17
-
18
-
19
-
20
-
21
-
22
-
23
-
24
-
25
-
26
-
27
-
28
-
29
-
30
-
31
-
32
-
33
-
34
-
35
-
36
-
37
-
38
-
39
-
40
-
41
-
42
-
43
-
44
-
45
-
46
-
47
-
48
-
49
-
50
-
51
-
52
-
53
-
54
-
55
-
56
-
57
-
58
-
59
-
60
-
61
-
62
-
63
-
64
-
65
-
66
-
67
-
68
-
69
-
70
-
71
-
72
-
73
-
74
-
75
-
76
-
77
-
78
-
79
-
80
-
81
-
82
-
83
-
84
-
85
-
86
-
87
-
88
-
89
-
90
-
91
-
92
-
93
-
94
-
95
-
96
-
97
-
98
-
99
-
100
-
101
-
102
-
103
-
104
-
105
-
106
-
 107
107 -
 108
108 -
 109
109 -
 110
110 -
 111
111 -
 112
112 -
 113
113 -
 114
114 -
 115
115 -
 116
116 -
 117
117 -
 118
118 -
 119
119 -
 120
120 -
 121
121 -
 122
122 -
 123
123 -
 124
124 -
 125
125 -
 126
126 -
 127
127 -
128
-
129
-
130
-
131
-
132
-
133
-
134
-
135
-
136
-
137
-
138
-
139
-
140
-
141
-
142
-
143
-
144
-
145
-
146
-
147
-
148
-
149
-
150
-
151
-
152
-
153
-
154
-
155
-
156
-
157
-
158
-
159
-
160
-
161
-
162
-
163
-
164
-
165
-
166
-
167
-
168
-
169
-
170
-
171
-
172
-
173
-
174
-
175
-
176
-
177
-
178
-
179
-
180
-
181
-
182
-
183
 |
 |

37
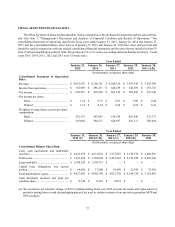
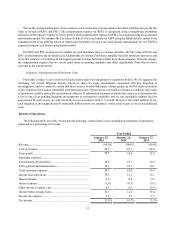
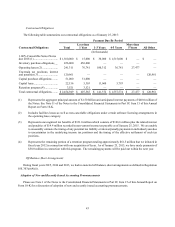
Revenue from significant customers, those representing 10% or more of total revenue for the respective dates, is
summarized as follows:
Year Ended
January 25,
2015 January 26,
2014 January 27,
2013
Revenue:
Customer A........................................................................................... 11% 11% 13%
Customer B........................................................................................... 9% 10% 9%
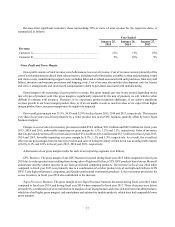
Gross Profit and Gross Margin
Gross profit consists of total revenue, net of allowances, less cost of revenue. Cost of revenue consists primarily of the
cost of semiconductors purchased from subcontractors, including wafer fabrication, assembly, testing and packaging, board
and device costs, manufacturing support costs, including labor and overhead associated with such purchases, final test yield
fallout, inventory and warranty provisions and shipping costs. Cost of revenue also includes development costs for license
and service arrangements and stock-based compensation related to personnel associated with manufacturing.
Gross margin is the percentage of gross profit to revenue. Our gross margin can vary in any period depending on the
mix of types of products sold. Our gross margin is significantly impacted by the mix of products we sell, which is often
difficult to estimate with accuracy. Therefore, if we experience product transition challenges, if we achieve significant
revenue growth in our lower margin product lines, or if we are unable to earn as much revenue as we expect from higher
margin product lines, our gross margin may be negatively impacted.
Our overall gross margin was 55.5%, 54.9% and 52.0% for fiscal years 2015, 2014 and 2013, respectively. The increase
over these fiscal years was driven primarily by a richer product mix in our GPU business, partially offset by lower Tegra
business margins.
Charges to cost of sales for inventory provisions totaled $59.4 million, $50.1 million and $89.9 million for fiscal years
2015, 2014 and 2013, unfavorably impacting our gross margin by 1.3%, 1.2% and 2.1%, respectively. Sales of inventory
that was previously written-off or written-down totaled $32.4 million, $43.4 million and $53.7 million for fiscal years 2015,
2014 and 2013, favorably impacting our gross margin by 0.7%, 1.1% and 1.3%, respectively. As a result, the overall net
effect on our gross margin from inventory provisions and sales of items previously written down was an unfavorable impact
of 0.6%, 0.1% and 0.8% in fiscal years 2015, 2014 and 2013, respectively.
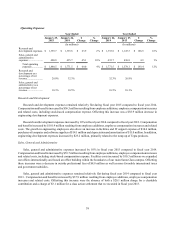
A discussion of our gross margin results for each of our reporting segments is as follows:
GPU Business. The gross margin of our GPU business increased during fiscal year 2015 when compared to fiscal year
2014 due to richer product mix resulting from strong sales of high-end GeForce GTX GPU products based on our Maxwell
architecture and the volume increase in our Tesla accelerated computing products. The increase in fiscal year 2014 when
compared to fiscal year 2013 was primarily due to a combination of a richer product mix of our high-end GeForce GTX
GPU, Tesla high performance computing, and Quadro professional workstation products. Lower inventory provisions for
excess inventory in fiscal year 2014 also contributed to the increase.
Tegra Processor Business. The gross margin of our Tegra Processor business decreased during fiscal year 2015 when
compared to fiscal year 2014, and during fiscal year 2014 when compared to fiscal year 2013. These decreases were driven
primarily by a combination of an overall decline in margins of our Tegra products and a less rich mix between tablet products,
which have had higher gross margins, and smartphone and automotive module products, which have had comparably lower
gross margins.