NVIDIA 2015 Annual Report Download - page 150
Download and view the complete annual report
Please find page 150 of the 2015 NVIDIA annual report below. You can navigate through the pages in the report by either clicking on the pages listed below, or by using the keyword search tool below to find specific information within the annual report.-
 1
1 -
2
-
3
-
4
-
5
-
6
-
7
-
8
-
9
-
10
-
11
-
12
-
13
-
14
-
15
-
16
-
17
-
18
-
19
-
20
-
21
-
22
-
23
-
24
-
25
-
26
-
27
-
28
-
29
-
30
-
31
-
32
-
33
-
34
-
35
-
36
-
37
-
38
-
39
-
40
-
41
-
42
-
43
-
44
-
45
-
46
-
47
-
48
-
49
-
50
-
51
-
52
-
53
-
54
-
55
-
56
-
57
-
58
-
59
-
60
-
61
-
62
-
63
-
64
-
65
-
66
-
67
-
68
-
69
-
70
-
71
-
72
-
73
-
74
-
75
-
76
-
77
-
78
-
79
-
80
-
81
-
82
-
83
-
84
-
85
-
86
-
87
-
88
-
89
-
90
-
91
-
92
-
93
-
94
-
95
-
96
-
97
-
98
-
99
-
100
-
101
-
102
-
103
-
104
-
105
-
106
-
107
-
108
-
109
-
110
-
111
-
112
-
113
-
114
-
115
-
116
-
117
-
118
-
119
-
120
-
121
-
122
-
123
-
124
-
125
-
126
-
127
-
128
-
129
-
130
-
131
-
132
-
133
-
134
-
135
-
136
-
137
-
138
-
139
-
 140
140 -
 141
141 -
 142
142 -
 143
143 -
 144
144 -
 145
145 -
 146
146 -
 147
147 -
 148
148 -
 149
149 -
 150
150 -
 151
151 -
 152
152 -
 153
153 -
 154
154 -
 155
155 -
 156
156 -
 157
157 -
 158
158 -
 159
159 -
 160
160 -
161
-
162
-
163
-
164
-
165
-
166
-
167
-
168
-
169
-
170
-
171
-
172
-
173
-
174
-
175
-
176
-
177
-
178
-
179
-
180
-
181
-
182
-
183
 |
 |

NVIDIA CORPORATION AND SUBSIDIARIES
NOTES TO THE CONSOLIDATED FINANCIAL STATEMENTS
(Continued)
70
we perform either a qualitative or a quantitative analysis on a reporting unit basis. We utilized a quantitative analysis to
complete our most recent annual impairment test during the fourth quarter of fiscal year 2015 and concluded that there was
no impairment, as the fair value of our reporting units exceeded their carrying values.
In a qualitative analysis, we evaluate factors including, but not limited to, macro-economic conditions, market and
industry conditions, the competitive environment, the operational stability and the overall financial performance of the
reporting units, including cost factors and actual revenue results. For reporting units in which the qualitative assessment
concludes it is more likely than not that the fair value is more than its carrying value, no further goodwill impairment testing
is required.
For those reporting units where a significant change or event has occurred, where potential impairment indicators exist,
or for which we have not performed a quantitative assessment recently, we utilize a two-step quantitative assessment to
testing goodwill for impairment. The first step tests for possible impairment by applying a fair value-based test by weighing
the results from the income approach and the market approach. These valuation approaches consider a number of factors
that include, but are not limited to, prospective financial information, growth rates, terminal or residual values, discount
rates and comparable multiples from publicly traded companies in our industry and require us to make certain assumptions
and estimates regarding industry economic factors and the future profitability of our business.
When performing an income approach valuation, we incorporate the use of projected financial information and a
discount rate that are developed using market participant based assumptions to our discounted cash flow model. Our estimates
of discounted cash flow were based upon, among other things, certain assumptions about our expected future operating
performance, such as revenue growth rates, operating margins, risk-adjusted discount rates, and future economic and market
conditions. The market method of determining the fair value of our reporting units requires us to use judgment in the selection
of appropriate market comparables.
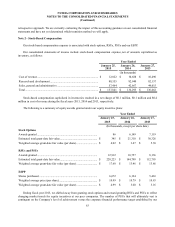
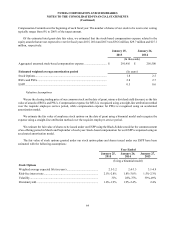
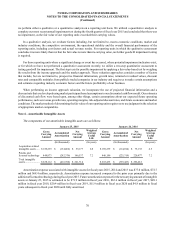
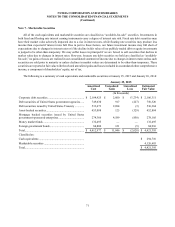
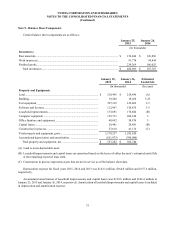
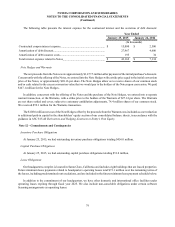
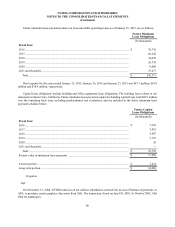
Note 6 - Amortizable Intangible Assets
The components of our amortizable intangible assets are as follows:
January 25, 2015 January 26, 2014
Gross
Carrying
Amount
Accumulated
Amortization
Net
Carrying
Amount
Weighted
Average
Useful
Life
Gross
Carrying
Amount
Accumulated
Amortization
Net
Carrying
Amount
Weighted
Average
Useful
Life
(In thousands) (In years) (In thousands) (In years)
Acquisition-related
intangible assets ..... $ 189,239 $ (134,062) $ 55,177 6.8 $ 189,239 $ (114,104) $ 75,135 6.5
Patents and
licensed technology 448,873 (282,336) 166,537 7.2 446,196 (225,319) 220,877 7.2
Total intangible
assets ...................... $ 638,112 $ (416,398) $ 221,714 $ 635,435 $ (339,423) $ 296,012
Amortization expense associated with intangible assets for fiscal years 2015, 2014 and 2013 was $77.0 million, $72.7
million and $68.4 million, respectively. Amortization expense increased compared to the prior year primarily due to the
addition of licensed technology during fiscal year 2015. Future amortization expense for the net carrying amount of intangible
assets at January 25, 2015 is estimated to be $71.9 million in fiscal year 2016, $63.6 million in fiscal year 2017, $49.1
million in fiscal year 2018, $20.4 million in fiscal year 2019, $11.9 million in fiscal year 2020 and $4.8 million in fiscal
years subsequent to fiscal year 2020 until fully amortized.