NVIDIA 2015 Annual Report Download - page 154
Download and view the complete annual report
Please find page 154 of the 2015 NVIDIA annual report below. You can navigate through the pages in the report by either clicking on the pages listed below, or by using the keyword search tool below to find specific information within the annual report.-
 1
1 -
2
-
3
-
4
-
5
-
6
-
7
-
8
-
9
-
10
-
11
-
12
-
13
-
14
-
15
-
16
-
17
-
18
-
19
-
20
-
21
-
22
-
23
-
24
-
25
-
26
-
27
-
28
-
29
-
30
-
31
-
32
-
33
-
34
-
35
-
36
-
37
-
38
-
39
-
40
-
41
-
42
-
43
-
44
-
45
-
46
-
47
-
48
-
49
-
50
-
51
-
52
-
53
-
54
-
55
-
56
-
57
-
58
-
59
-
60
-
61
-
62
-
63
-
64
-
65
-
66
-
67
-
68
-
69
-
70
-
71
-
72
-
73
-
74
-
75
-
76
-
77
-
78
-
79
-
80
-
81
-
82
-
83
-
84
-
85
-
86
-
87
-
88
-
89
-
90
-
91
-
92
-
93
-
94
-
95
-
96
-
97
-
98
-
99
-
100
-
101
-
102
-
103
-
104
-
105
-
106
-
107
-
108
-
109
-
110
-
111
-
112
-
113
-
114
-
115
-
116
-
117
-
118
-
119
-
120
-
121
-
122
-
123
-
124
-
125
-
126
-
127
-
128
-
129
-
130
-
131
-
132
-
133
-
134
-
135
-
136
-
137
-
138
-
139
-
140
-
141
-
142
-
143
-
 144
144 -
 145
145 -
 146
146 -
 147
147 -
 148
148 -
 149
149 -
 150
150 -
 151
151 -
 152
152 -
 153
153 -
 154
154 -
 155
155 -
 156
156 -
 157
157 -
 158
158 -
 159
159 -
 160
160 -
 161
161 -
 162
162 -
 163
163 -
 164
164 -
165
-
166
-
167
-
168
-
169
-
170
-
171
-
172
-
173
-
174
-
175
-
176
-
177
-
178
-
179
-
180
-
181
-
182
-
183
 |
 |

NVIDIA CORPORATION AND SUBSIDIARIES
NOTES TO THE CONSOLIDATED FINANCIAL STATEMENTS
(Continued)
74
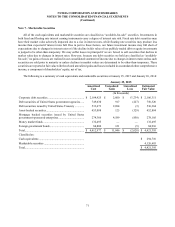
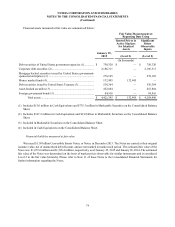
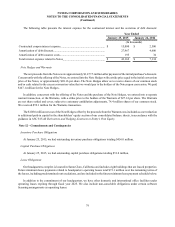
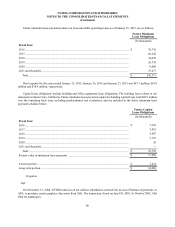
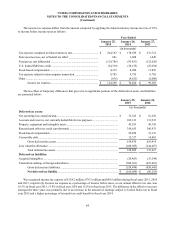
Financial assets measured at fair value are summarized below:
Fair Value Measurement at
Reporting Date Using
Quoted Prices in
Active Markets
for Identical
Assets
Significant
Other
Observable
Inputs
January 25,
2015 (Level 1) (Level 2)
(In thousands)
Debt securities of United States government agencies (1).............. $ 750,320 $ — $ 750,320
Corporate debt securities (2)........................................................... 2,186,311 — 2,186,311
Mortgage backed securities issued by United States government-
sponsored enterprises (3) ................................................................ 278,105 — 278,105
Money market funds (4).................................................................. 132,495 132,495 —
Debt securities issued by United States Treasury (3)...................... 536,364 — 536,364
Asset-backed securities (3) ............................................................. 452,884 — 452,884
Foreign government bonds (3)........................................................ 84,916 — 84,916
Total assets.......................................................................... $ 4,421,395 $ 132,495 $ 4,288,900
(1) Includes $15.0 million in Cash Equivalents and $735.3 million in Marketable Securities on the Consolidated Balance
Sheet.
(2) Includes $147.2 million in Cash Equivalents and $2.0 billion in Marketable Securities on the Consolidated Balance
Sheet.
(3) Included in Marketable Securities on the Consolidated Balance Sheet.
(4) Included in Cash Equivalents on the Consolidated Balance Sheet.
Financial liabilities measured at fair value
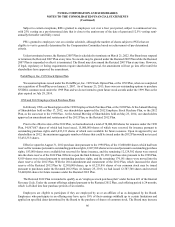
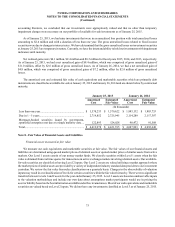
We issued $1.50 billion Convertible Senior Notes, or Notes, in December 2013. The Notes are carried at their original
issuance value, net of unamortized debt discount, and are not marked to market each period. The estimated fair value of the
Notes was $1,679.6 million and $1,528.4 million, respectively, as of January 25, 2015 and January 26, 2014. The estimated
fair value of the Notes was determined on the basis of market prices observable for similar instruments and is considered
Level 2 in the fair value hierarchy. Please refer to Note 11 of these Notes to the Consolidated Financial Statements for
further information regarding the Notes.