NVIDIA 2015 Annual Report Download - page 106
Download and view the complete annual report
Please find page 106 of the 2015 NVIDIA annual report below. You can navigate through the pages in the report by either clicking on the pages listed below, or by using the keyword search tool below to find specific information within the annual report.-
 1
1 -
2
-
3
-
4
-
5
-
6
-
7
-
8
-
9
-
10
-
11
-
12
-
13
-
14
-
15
-
16
-
17
-
18
-
19
-
20
-
21
-
22
-
23
-
24
-
25
-
26
-
27
-
28
-
29
-
30
-
31
-
32
-
33
-
34
-
35
-
36
-
37
-
38
-
39
-
40
-
41
-
42
-
43
-
44
-
45
-
46
-
47
-
48
-
49
-
50
-
51
-
52
-
53
-
54
-
55
-
56
-
57
-
58
-
59
-
60
-
61
-
62
-
63
-
64
-
65
-
66
-
67
-
68
-
69
-
70
-
71
-
72
-
73
-
74
-
75
-
76
-
77
-
78
-
79
-
80
-
81
-
82
-
83
-
84
-
85
-
86
-
87
-
88
-
89
-
90
-
91
-
92
-
93
-
94
-
95
-
 96
96 -
 97
97 -
 98
98 -
 99
99 -
 100
100 -
 101
101 -
 102
102 -
 103
103 -
 104
104 -
 105
105 -
 106
106 -
 107
107 -
 108
108 -
 109
109 -
 110
110 -
 111
111 -
 112
112 -
 113
113 -
 114
114 -
 115
115 -
 116
116 -
117
-
118
-
119
-
120
-
121
-
122
-
123
-
124
-
125
-
126
-
127
-
128
-
129
-
130
-
131
-
132
-
133
-
134
-
135
-
136
-
137
-
138
-
139
-
140
-
141
-
142
-
143
-
144
-
145
-
146
-
147
-
148
-
149
-
150
-
151
-
152
-
153
-
154
-
155
-
156
-
157
-
158
-
159
-
160
-
161
-
162
-
163
-
164
-
165
-
166
-
167
-
168
-
169
-
170
-
171
-
172
-
173
-
174
-
175
-
176
-
177
-
178
-
179
-
180
-
181
-
182
-
183
 |
 |

26
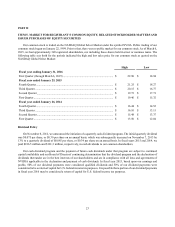
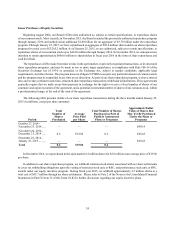
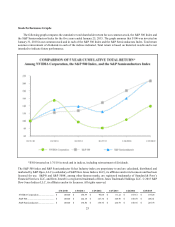
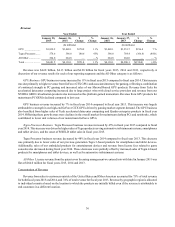
The following graph compares the cumulative total shareholder return for our common stock, the S&P 500 Index and
the S&P Semiconductors Index for the ten years ended January 25, 2015. The graph assumes that $100 was invested on
January 30, 2005 in our common stock and in each of the S&P 500 Index and the S&P Semiconductors Index. Total return
assumes reinvestment of dividends in each of the indices indicated. Total return is based on historical results and is not
intended to indicate future performance.
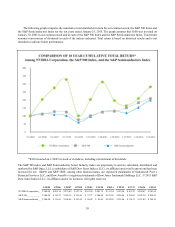
*$100 invested on 1/30/05 in stock or in indices, including reinvestment of dividends.
The S&P 500 index and S&P Semiconductor Select Industry index are proprietary to and are calculated, distributed and
marketed by S&P Opco, LLC (a subsidiary of S&P Dow Jones Indices LLC), its affiliates and/or its licensors and has been
licensed for use. S&P® and S&P 500®, among other famous marks, are registered trademarks of Standard & Poor’s
Financial Services LLC, and Dow Jones® is a registered trademark of Dow Jones Trademark Holdings LLC. © 2015 S&P
Dow Jones Indices LLC, its affiliates and/or its licensors. All rights reserved.
1/30/05 1/29/06 1/28/07 1/27/08 1/25/09 1/31/10 1/30/11 1/29/12 1/27/13 1/26/14 1/25/15
NVIDIA Corporation.... $100.00 $ 202.14 $ 275.09 $ 327.14 $ 101.09 $ 201.79 $ 311.54 $ 195.50 $163.70 $ 209.07 $ 281.05
S&P 500........................ $100.00 $ 110.37 $ 126.39 $ 123.46 $ 75.77 $ 100.88 $ 123.26 $ 128.46 $ 150.02 $ 182.30 $ 208.23
S&P Semiconductors.... $100.00 $ 115.62 $ 108.86 $ 101.45 $ 60.82 $ 95.46 $124.59 $ 132.46 $ 119.13 $ 153.09 $ 198.36