NVIDIA 2015 Annual Report Download - page 115
Download and view the complete annual report
Please find page 115 of the 2015 NVIDIA annual report below. You can navigate through the pages in the report by either clicking on the pages listed below, or by using the keyword search tool below to find specific information within the annual report.-
 1
1 -
2
-
3
-
4
-
5
-
6
-
7
-
8
-
9
-
10
-
11
-
12
-
13
-
14
-
15
-
16
-
17
-
18
-
19
-
20
-
21
-
22
-
23
-
24
-
25
-
26
-
27
-
28
-
29
-
30
-
31
-
32
-
33
-
34
-
35
-
36
-
37
-
38
-
39
-
40
-
41
-
42
-
43
-
44
-
45
-
46
-
47
-
48
-
49
-
50
-
51
-
52
-
53
-
54
-
55
-
56
-
57
-
58
-
59
-
60
-
61
-
62
-
63
-
64
-
65
-
66
-
67
-
68
-
69
-
70
-
71
-
72
-
73
-
74
-
75
-
76
-
77
-
78
-
79
-
80
-
81
-
82
-
83
-
84
-
85
-
86
-
87
-
88
-
89
-
90
-
91
-
92
-
93
-
94
-
95
-
96
-
97
-
98
-
99
-
100
-
101
-
102
-
103
-
104
-
 105
105 -
 106
106 -
 107
107 -
 108
108 -
 109
109 -
 110
110 -
 111
111 -
 112
112 -
 113
113 -
 114
114 -
 115
115 -
 116
116 -
 117
117 -
 118
118 -
 119
119 -
 120
120 -
 121
121 -
 122
122 -
 123
123 -
 124
124 -
 125
125 -
126
-
127
-
128
-
129
-
130
-
131
-
132
-
133
-
134
-
135
-
136
-
137
-
138
-
139
-
140
-
141
-
142
-
143
-
144
-
145
-
146
-
147
-
148
-
149
-
150
-
151
-
152
-
153
-
154
-
155
-
156
-
157
-
158
-
159
-
160
-
161
-
162
-
163
-
164
-
165
-
166
-
167
-
168
-
169
-
170
-
171
-
172
-
173
-
174
-
175
-
176
-
177
-
178
-
179
-
180
-
181
-
182
-
183
 |
 |

35
We use the closing trading price of our common stock on the date of grant, minus a dividend yield discount, as the fair
value of awards of RSUs and PSUs. The compensation expense for RSUs is recognized using a straight-line attribution
method over the requisite employee service period, while compensation expense for PSUs is recognized using an accelerated
amortization model. We estimate the fair value of shares to be issued under our ESPP using the Black-Scholes model at the
commencement of an offering period in March and September of each year. Stock-based compensation for our ESPP is
expensed using an accelerated amortization model.
Our RSU and PSU awards are not eligible for cash dividends prior to vesting; therefore, the fair value of RSUs and
PSUs is discounted by the dividend yield. Additionally, we estimate forfeitures annually based on historical experience and
revise the estimates of forfeiture in subsequent periods if actual forfeitures differ from those estimates. If factors change,
the compensation expense that we record under these accounting standards may differ significantly from what we have
recorded in the current period.
Litigation, Investigation and Settlement Costs
From time to time, we are involved in legal actions and/or investigations by regulatory bodies. We are aggressively
defending our current litigation matters. However, there are many uncertainties associated with any litigation or
investigations, and we cannot be certain that these actions or other third-party claims against us will be resolved without
costly litigation, fines and/or substantial settlement payments. If that occurs, our business, financial condition and results
of operations could be materially and adversely affected. If information becomes available that causes us to determine that
a loss in any of our pending litigation, investigations or settlements is probable, and we can reasonably estimate the loss
associated with such events, we will record the loss in accordance with U.S. GAAP. However, the actual liability in any
such litigation or investigation may be materially different from our estimates, which could require us to record additional
costs.
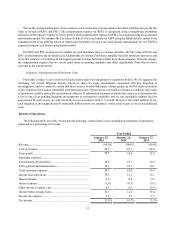
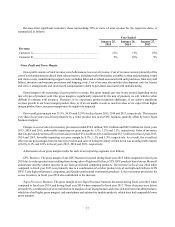
Results of Operations
The following table sets forth, for the periods indicated, certain items in our consolidated statements of operations
expressed as a percentage of revenue.
Year Ended
January 25,
2015 January 26,
2014 January 27,
2013
Revenue .................................................................................... 100.0% 100.0% 100.0%
Cost of revenue......................................................................... 44.5 45.1 48.0
Gross profit............................................................................... 55.5 54.9 52.0
Operating expenses:..................................................................
Research and development ....................................................... 29.0 32.3 26.8
Sales, general and administrative ............................................. 10.3 10.5 10.1
Total operating expenses........................................................... 39.3 42.8 36.9
Income from operations............................................................ 16.2 12.1 15.1
Interest income.......................................................................... 0.6 0.4 0.5
Interest expense ........................................................................ (1.0)(0.3)(0.1)
Other income (expense), net..................................................... 0.3 0.2 (0.1)
Income before income taxes..................................................... 16.1 12.4 15.4
Income tax expense................................................................... 2.6 1.7 2.3
Net income................................................................................ 13.5% 10.7% 13.1%