NVIDIA 2015 Annual Report Download - page 133
Download and view the complete annual report
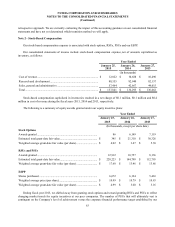
Please find page 133 of the 2015 NVIDIA annual report below. You can navigate through the pages in the report by either clicking on the pages listed below, or by using the keyword search tool below to find specific information within the annual report.-
 1
1 -
2
-
3
-
4
-
5
-
6
-
7
-
8
-
9
-
10
-
11
-
12
-
13
-
14
-
15
-
16
-
17
-
18
-
19
-
20
-
21
-
22
-
23
-
24
-
25
-
26
-
27
-
28
-
29
-
30
-
31
-
32
-
33
-
34
-
35
-
36
-
37
-
38
-
39
-
40
-
41
-
42
-
43
-
44
-
45
-
46
-
47
-
48
-
49
-
50
-
51
-
52
-
53
-
54
-
55
-
56
-
57
-
58
-
59
-
60
-
61
-
62
-
63
-
64
-
65
-
66
-
67
-
68
-
69
-
70
-
71
-
72
-
73
-
74
-
75
-
76
-
77
-
78
-
79
-
80
-
81
-
82
-
83
-
84
-
85
-
86
-
87
-
88
-
89
-
90
-
91
-
92
-
93
-
94
-
95
-
96
-
97
-
98
-
99
-
100
-
101
-
102
-
103
-
104
-
105
-
106
-
107
-
108
-
109
-
110
-
111
-
112
-
113
-
114
-
115
-
116
-
117
-
118
-
119
-
120
-
121
-
122
-
 123
123 -
 124
124 -
 125
125 -
 126
126 -
 127
127 -
 128
128 -
 129
129 -
 130
130 -
 131
131 -
 132
132 -
 133
133 -
 134
134 -
 135
135 -
 136
136 -
 137
137 -
 138
138 -
 139
139 -
 140
140 -
 141
141 -
 142
142 -
 143
143 -
144
-
145
-
146
-
147
-
148
-
149
-
150
-
151
-
152
-
153
-
154
-
155
-
156
-
157
-
158
-
159
-
160
-
161
-
162
-
163
-
164
-
165
-
166
-
167
-
168
-
169
-
170
-
171
-
172
-
173
-
174
-
175
-
176
-
177
-
178
-
179
-
180
-
181
-
182
-
183
 |
 |

53
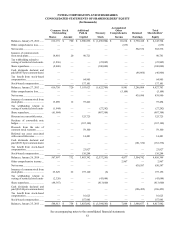
NVIDIA CORPORATION AND SUBSIDIARIES
CONSOLIDATED STATEMENTS OF SHAREHOLDERS’ EQUITY
(In thousands)
Common Stock
Outstanding Additional
Paid-in Treasury
Accumulated
Other
Comprehensive Retained Total
Shareholders'
Shares Amount Capital Stock Income Earnings Equity
Balances, January 29, 2012 ...... 612,191 $ 700 $ 2,900,896 $ (1,496,904) $ 10,614 $ 2,730,418 $ 4,145,724
Other comprehensive loss......... — — — — (633) — (633)
Net income................................ — — — — — 562,536 562,536
Issuance of common stock
from stock plans
........................ 14,801 20 90,721 — — — 90,741
Tax withholding related to
vesting of restricted stock units (1,836) — — (25,805) — — (25,805)
Share repurchase....................... (8,400) — — (100,000) — — (100,000)
Cash dividends declared and
paid ($0.075 per common share) — — — — — (46,866) (46,866)
Tax benefit from stock-based
compensation
............................ — — 64,905 — — — 64,905
Stock-based compensation ....... — — 137,101 — — — 137,101
Balances, January 27, 2013 ...... 616,756 720 3,193,623 (1,622,709) 9,981 3,246,088 4,827,703
Other comprehensive loss......... — — — — (5,104) — (5,104)
Net income................................ — — — — — 439,990 439,990
Issuance of common stock from
stock plans ................................ 15,089 12 97,442 — — — 97,454
Tax withholding related to
vesting of restricted stock units (1,944) — — (27,282) — — (27,282)
Share repurchase....................... (61,904) — — (887,304) — — (887,304)
Discount on convertible notes .. — — 125,725 — — — 125,725
Purchase of convertible note
hedges....................................... — — (167,100) — — — (167,100)
Proceeds from the sale of
common stock warrants............ — — 59,100 — — — 59,100
Deferred tax asset associated
with convertible notes............... — — 14,481 — — — 14,481
Cash dividends declared and
paid ($0.310 per common share) — — — — — (181,336) (181,336)
Tax benefit from stock-based
compensation
............................ — — 23,827 — — — 23,827
Stock-based compensation ....... — — 136,244 — — — 136,244
Balances, January 26, 2014 ...... 567,997 732 3,483,342 (2,537,295) 4,877 3,504,742 4,456,398
Other comprehensive income... — — — — 2,967 — 2,967
Net income................................ — — — — — 630,587 630,587
Issuance of common stock from
stock plans ................................ 23,629 22 197,140 (6) — — 197,156
Tax withholding related to
vesting of restricted stock units (2,326) — — (43,684) — — (43,684)
Share repurchase....................... (44,387) — — (813,600) — — (813,600)
Cash dividends declared and
paid ($0.340 per common share) — — — — — (186,452) (186,452)
Tax benefit from stock-based
compensation
............................ — — 16,625 — — — 16,625
Stock-based compensation ....... — — 157,985 — — — 157,985
Balances, January 25, 2015 ...... 544,913 $ 754 $ 3,855,092 $ (3,394,585) $ 7,844 $ 3,948,877 $ 4,417,982
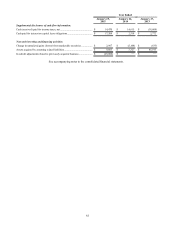
See accompanying notes to the consolidated financial statements.