Chevron 2012 Annual Report Download - page 86
Download and view the complete annual report
Please find page 86 of the 2012 Chevron annual report below. You can navigate through the pages in the report by either clicking on the pages listed below, or by using the keyword search tool below to find specific information within the annual report.-
 1
1 -
2
-
3
-
4
-
5
-
6
-
7
-
8
-
9
-
10
-
11
-
12
-
13
-
14
-
15
-
16
-
17
-
18
-
19
-
20
-
21
-
22
-
23
-
24
-
25
-
26
-
27
-
28
-
29
-
30
-
31
-
32
-
33
-
34
-
35
-
36
-
37
-
38
-
39
-
40
-
41
-
42
-
43
-
44
-
45
-
46
-
47
-
48
-
49
-
50
-
51
-
52
-
53
-
54
-
55
-
56
-
57
-
58
-
59
-
60
-
61
-
62
-
63
-
64
-
65
-
66
-
67
-
68
-
69
-
70
-
71
-
72
-
73
-
74
-
75
-
 76
76 -
 77
77 -
 78
78 -
 79
79 -
 80
80 -
 81
81 -
 82
82 -
 83
83 -
 84
84 -
 85
85 -
 86
86 -
 87
87 -
 88
88 -
 89
89 -
 90
90 -
 91
91 -
 92
92
 |
 |

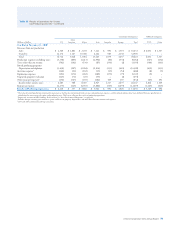
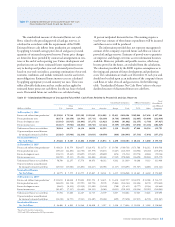
Table VII Changes in the Standardized Measure of Discounted
Future Net Cash Flows From Proved Reserves
84 Chevron Corporation 2012 Annual Report
ing production volumes and costs. Changes in the timing
of production are included with “Revisions of previous
quantityestimates.”
Table VII – Changes in the Standardized Measure of Discounted Future Net Cash Flows From Proved Reserves
Tot a l
Consolidated
and Affiliated
Millions of dollars Consolidated Companies Affiliated Companies Companies
Present Value at January 1, 2010* $ 50,276 $ 27,236 $ 77,512
Sales and transfers of oil and gas produced net of production costs (39,047) (6,377) (45,424)
Development costs incurred 12,042 572 12,614
Purchases of reserves 513 – 513
Sales of reserves (47) – (47)
Extensions, discoveries and improved recovery less related costs 5,194 63 5,257
Revisions of previous quantity estimates 9,704 1,113 10,817
Net changes in prices, development and production costs 43,887 14,429 58,316
Accretion of discount 8,391 3,797 12,188
Net change in income tax (17,889) (5,214) (23,103)
Net change for 2010 22,748 8,383 31,131
Present Value at December 31, 20101 $ 73,024 $ 35,619 $ 108,643
Sales and transfers of oil and gas produced net of production costs (52,338) (8,679) (61,017)
Development costs incurred 13,869 729 14,598
Purchases of reserves 1,212 – 1,212
Sales of reserves (803) – (803)
Extensions, discoveries and improved recovery less related costs 12,288 – 12,288
Revisions of previous quantity estimates 16,025 923 16,948
Net changes in prices, development and production costs 61,428 15,979 77,407
Accretion of discount 11,943 5,048 16,991
Net change in income tax (29,700) (3,728) (33,428)
Net change for 2011 33,924 10,272 44,196
Present Value at December 31, 2011 $ 106,948 $ 45,891 $ 152,839
Sales and transfers of oil and gas produced net of production costs (49,094) (7,708) (56,802)
Development costs incurred 18,013 942 18,955
Purchases of reserves 376 – 376
Sales of reserves (1,630) – (1,630)
Extensions, discoveries and improved recovery less related costs 11,303 106 11,409
Revisions of previous quantity estimates 23,556 3,759 27,315
Net changes in prices, development and production costs (19,179) (2,266) (21,445)
Accretion of discount 18,026 6,322 24,348
Net change in income tax 1,985 (1,832) 153
Net change for 2012 3,356 (677) 2,679
Present Value at December 31, 2012 $ 110,304 $ 45,214 $ 155,518
* 2011 and 2010 conformed to 2012 presentation.
e changes in present values between years, which can
be signicant, reect changes in estimated proved-reserve
quantities and prices and assumptions used in forecast-