Chevron 2012 Annual Report Download - page 6
Download and view the complete annual report
Please find page 6 of the 2012 Chevron annual report below. You can navigate through the pages in the report by either clicking on the pages listed below, or by using the keyword search tool below to find specific information within the annual report.-
 1
1 -
 2
2 -
 3
3 -
 4
4 -
 5
5 -
 6
6 -
 7
7 -
 8
8 -
 9
9 -
 10
10 -
 11
11 -
 12
12 -
 13
13 -
 14
14 -
 15
15 -
 16
16 -
 17
17 -
18
-
19
-
20
-
21
-
22
-
23
-
24
-
25
-
26
-
27
-
28
-
29
-
30
-
31
-
32
-
33
-
34
-
35
-
36
-
37
-
38
-
39
-
40
-
41
-
42
-
43
-
44
-
45
-
46
-
47
-
48
-
49
-
50
-
51
-
52
-
53
-
54
-
55
-
56
-
57
-
58
-
59
-
60
-
61
-
62
-
63
-
64
-
65
-
66
-
67
-
68
-
69
-
70
-
71
-
72
-
73
-
74
-
75
-
76
-
77
-
78
-
79
-
80
-
81
-
82
-
83
-
84
-
85
-
86
-
87
-
88
-
89
-
90
-
91
-
92
 |
 |
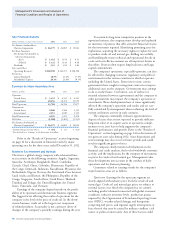
4Chevron Corporation 2012 Annual Report
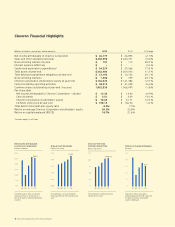
Millions of dollars, except per-share amounts 2012 2011 % Change
Net income attributable to Chevron Corporation $ 26,179 $ 26,895 (2.7) %
Sales and other operating revenues $ 230,590 $ 244,371 (5.6) %
Noncontrolling interests income $ 157 $ 113 38.9 %
Interest expense (after tax) $ — $ — 0.0 %
Capital and exploratory expenditures* $ 34,229 $ 29,066 17.8 %
Total assets at year-end $ 232,982 $ 209,474 11.2 %
Total debt and capital lease obligations at year-end $ 12,192 $ 10,152 20.1 %
Noncontrolling interests $ 1,308 $ 799 63.7 %
Chevron Corporation stockholders’ equity at year-end $ 136,524 $ 121,382 12.5 %
Cash provided by operating activities $ 38,812 $ 41,098 (5.6) %
Common shares outstanding at year-end (Thousands) 1,932,530 1,966,999 (1.8) %
Per-share data
Net income attributable to Chevron Corporation — diluted $ 13.32 $ 13.44 (0.9) %
Cash dividends $ 3.51 $ 3.09 13.6 %
Chevron Corporation stockholders’ equity $ 70.65 $ 61.71 14.5 %
Common stock price at year-end $ 108.14 $ 106.40 1.6 %
Total debt to total debt-plus-equity ratio 8.2% 7.7%
Return on average Chevron Corporation stockholders’ equity 20.3% 23.8%
Return on capital employed (ROCE) 18.7% 21.6%
Chevron Financial Highlights
*Includes equity in affiliates
0.0
30.0
20.0
15.0
5.0
10.0
25.0
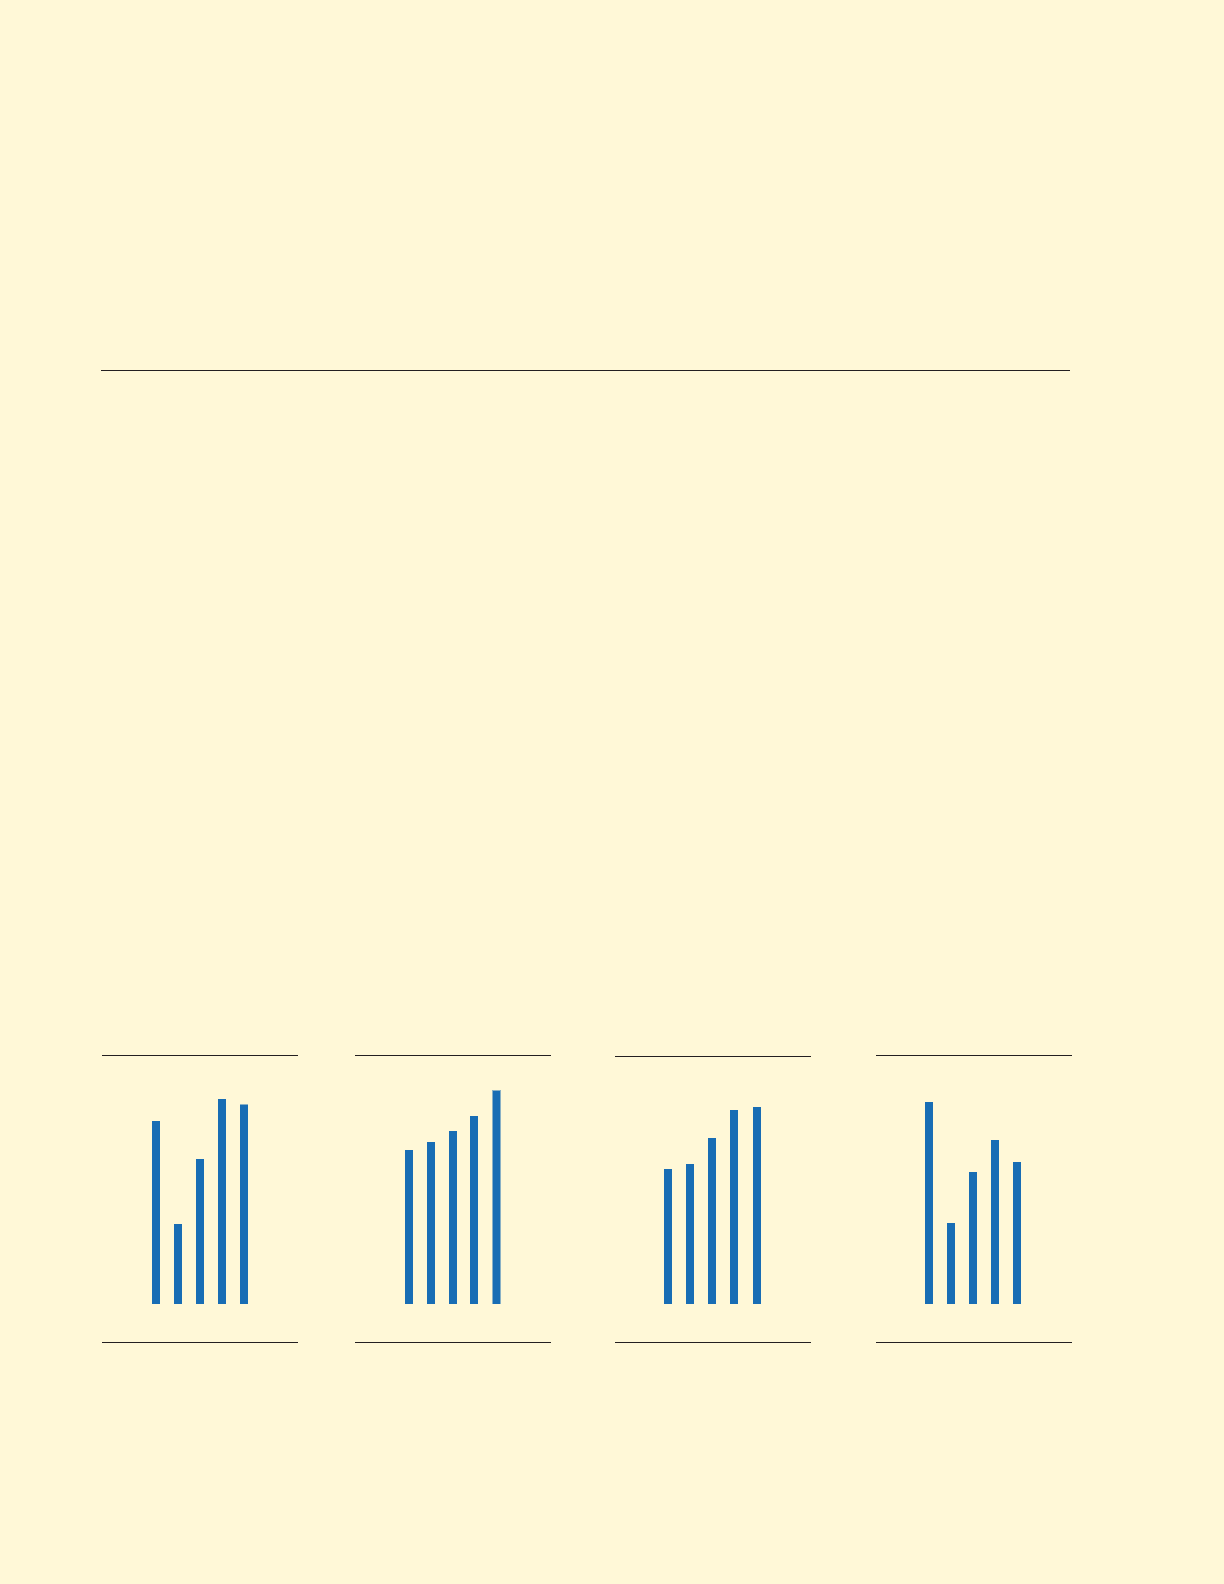
Net Income Attributable
to Chevron Corporation
Billions of dollars
The decrease in 2012 was due to
lower earnings in upstream as a
result of lower crude oil production
volume.
08 10 11 12
$26.2
09
0.00
3.75
3.00
2.25
0.75
1.50
Annual Cash Dividends
Dollars per share
The company’s annual dividend
increased for the 25th consecutive
year.
09
08 10 11 12
$3.51
0
125
100
75
50
25
Chevron Year-End
Common Stock Price
Dollars per share
The company’s stock price rose
1.6 percent in 2012.
0908 10 11 12
$108.14
0
30
24
18
12
6
Return on Capital Employed
Percent
Chevron’s return on capital
employed declined to 18.7 percent
on lower earnings and higher
capital employed.
0908 10 11 12
18.7