Chevron 2012 Annual Report Download - page 80
Download and view the complete annual report
Please find page 80 of the 2012 Chevron annual report below. You can navigate through the pages in the report by either clicking on the pages listed below, or by using the keyword search tool below to find specific information within the annual report.-
 1
1 -
2
-
3
-
4
-
5
-
6
-
7
-
8
-
9
-
10
-
11
-
12
-
13
-
14
-
15
-
16
-
17
-
18
-
19
-
20
-
21
-
22
-
23
-
24
-
25
-
26
-
27
-
28
-
29
-
30
-
31
-
32
-
33
-
34
-
35
-
36
-
37
-
38
-
39
-
40
-
41
-
42
-
43
-
44
-
45
-
46
-
47
-
48
-
49
-
50
-
51
-
52
-
53
-
54
-
55
-
56
-
57
-
58
-
59
-
60
-
61
-
62
-
63
-
64
-
65
-
66
-
67
-
68
-
69
-
 70
70 -
 71
71 -
 72
72 -
 73
73 -
 74
74 -
 75
75 -
 76
76 -
 77
77 -
 78
78 -
 79
79 -
 80
80 -
 81
81 -
 82
82 -
 83
83 -
 84
84 -
 85
85 -
 86
86 -
 87
87 -
 88
88 -
 89
89 -
 90
90 -
91
-
92
 |
 |

Proved Undeveloped Reserve Quantities At the end
of 2012, proved undeveloped reserves totaled 5.2 billion bar-
rels of oil-equivalent (BOE). Approximately 56 percent of
these reserves are attributed to natural gas, of which about 55
percent were located in Australia. Crude oil, condensate and
natural gas liquids (NGLs) accounted for about 38 percent
of the total proved undeveloped reserves, of which about 38
percent were from TCO, and the remaining large concentra-
tions were in Africa, Asia and the United States. Synthetic
oil accounted for the balance of the proved undeveloped
reserves.
In 2012, a total of 394 million BOE was transferred
from proved undeveloped to proved developed. In Asia, 98
million BOE were transferred to proved developed primarily
driven by development drilling performance. In the United
States, approximately 95 million BOE were transferred,
primarily due to ongoing drilling activities in the deepwater
Gulf of Mexico and California. Aliates accounted for 104
million BOE transferred to proved developed due to ongoing
development activities. Development drilling and the start
up of several projects in Africa, Europe and Other Americas
accounted for the remainder.
Investment to Convert Proved Undeveloped to Proved
Developed Reserves During 2012, investments totaling
approximately $10.7 billion in oil and gas producing activi-
ties and about $3.5 billion in non-oil and gas producing
activities were expended to advance the development of
proved undeveloped reserves. Australia accounted for $7.7
billion of the total, mainly for development and construction
activities at the Gorgon and Wheatstone LNG projects. In
Africa, another $2.3 billion was expended on various oshore
development and natural gas projects in Nigeria and Angola.
Expenditures of about $1.8 billion in the United States
related primarily to various development activities in the Gulf
of Mexico and the mid-continent region. In Asia, expendi-
tures during the year totaled $1.7 billion, primarily related to
development projects in ailand and Indonesia.
Proved Undeveloped Reserves for Five Years or
More Reserves that remain proved undeveloped for ve or more
years are a result of several factors that aect optimal project
development and execution, such as the complex nature of the
development project in adverse and remote locations, physical
limitations of infrastructure or plant capacities that dictate project
timing, compression projects that are pending reservoir pressure
declines, and contractual limitations that dictate production levels.
At year-end 2012, the company held approximately
1.7 billion BOE of proved undeveloped reserves that have
remained undeveloped for ve years or more. e reserves are
held by consolidated and aliated companies and the major-
ity of these reserves are in locations where the company has a
proven track record of developing major projects.
In Africa, the majority of the 300 million BOE is related
to deepwater and natural gas developments in Nigeria.
Major Nigerian deepwater development projects include
Agbami, which started production in 2008 and has ongoing
development activities to maintain full utilization of infra-
structure capacity, and the Usan development, which started
production in 2012. Also in Nigeria, various elds and
infrastructure associated with the Escravos Gas Projects are
currently under development.
In Asia, approximately 200 million BOE remain clas-
sied as proved undeveloped after ve years. e majority
relate to ongoing development activities in the Pattani Field
(ailand) and the Malampaya Field (Philippines) that are
scheduled to maintain production within contractual and
infrastructure constraints.
In Australia, approximately 100 million BOE remain
classied as proved undeveloped due to a compression proj-
ect at the North West Shelf Venture, which is scheduled for
start-up in 2013.
Aliated companies have approximately 1.0 billion BOE
of proved undeveloped reserves that have been recorded for
ve years or more. e TCO aliate in Kazakhstan accounts
for most of this amount. Production is constrained by plant
capacity limitations. In Venezuela, development drilling
continues at Hamaca to optimize utilization of upgrader
capacity.
Annually, the company assesses whether any changes
have occurred in facts or circumstances, such as changes to
development plans, regulations or government policies, that
would warrant a revision to reserve estimates. For 2012, this
assessment did not result in any material changes in reserves
classied as proved undeveloped. Over the past three years,
the ratio of proved undeveloped reserves to total proved
reserves has ranged between 37 percent and 46 percent. e
consistent completion of major capital projects has kept the
ratio in a narrow range over this time period.
Proved Reserve Quantities At December 31, 2012,
proved reserves for the company were 11.3billion BOE.
(Refer to the term “Reserves” on page 8 for the denition of
oil-equivalent reserves.) Approximately 17 percent of the total
reserves were located in the United States.
Aside from the TCO aliate’s Tengiz Field in
Kazakhstan, no single property accounted for more than 5
percent of the company’s total oil-equivalent proved reserves.
About 20 other individual properties in the company’s
portfolio of assets each contained between 1 percent and
5 percent of the company’s oil-equivalent proved reserves,
which in the aggregate accounted for 45 percent of the com-
pany’s total oil-equivalent proved reserves. ese properties
were geographically dispersed, located in the United States,
Canada, South America, Africa, Asia and Australia.
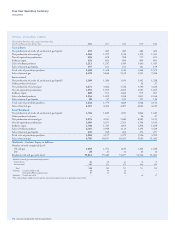
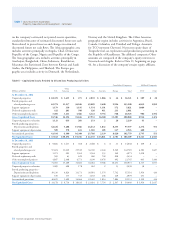
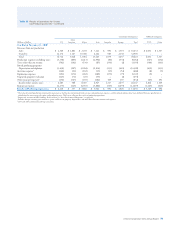
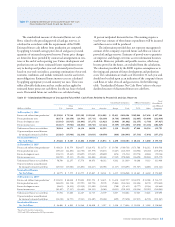
Table V Reserve Quantity Information – Continued
78 Chevron Corporation 2012 Annual Report