Chevron 2012 Annual Report Download - page 14
Download and view the complete annual report
Please find page 14 of the 2012 Chevron annual report below. You can navigate through the pages in the report by either clicking on the pages listed below, or by using the keyword search tool below to find specific information within the annual report.-
 1
1 -
2
-
3
-
 4
4 -
 5
5 -
 6
6 -
 7
7 -
 8
8 -
 9
9 -
 10
10 -
 11
11 -
 12
12 -
 13
13 -
 14
14 -
 15
15 -
 16
16 -
 17
17 -
 18
18 -
 19
19 -
 20
20 -
 21
21 -
 22
22 -
 23
23 -
 24
24 -
25
-
26
-
27
-
28
-
29
-
30
-
31
-
32
-
33
-
34
-
35
-
36
-
37
-
38
-
39
-
40
-
41
-
42
-
43
-
44
-
45
-
46
-
47
-
48
-
49
-
50
-
51
-
52
-
53
-
54
-
55
-
56
-
57
-
58
-
59
-
60
-
61
-
62
-
63
-
64
-
65
-
66
-
67
-
68
-
69
-
70
-
71
-
72
-
73
-
74
-
75
-
76
-
77
-
78
-
79
-
80
-
81
-
82
-
83
-
84
-
85
-
86
-
87
-
88
-
89
-
90
-
91
-
92
 |
 |

Management’s Discussion and Analysis of
Financial Condition and Results of Operations
12 Chevron Corporation 2012 Annual Report
Management’s Discussion and Analysis of
Financial Condition and Results of Operations
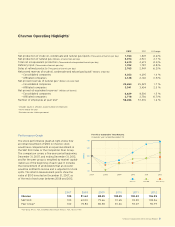
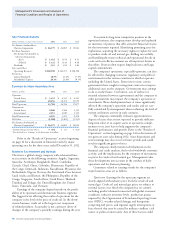
e company’s worldwide net oil-equivalent production
in 2012 averaged 2.610 million barrels per day. About one-
fth of the company’s net oil-equivalent production in 2012
occurred in the OPEC-member countries of Angola, Nigeria,
Venezuela and the Partitioned Zone between Saudi Arabia
and Kuwait. OPEC quotas had no eect on the company’s
net crude oil production in 2012 or 2011. At their December
2012 meeting, members of OPEC supported maintaining the
current production quota of 30 million barrels per day, which
has been in eect since December 2008.
e company estimates that oil-equivalent production
in 2013 will average approximately 2.650 million barrels per
day based on an average Brent price of $112 per barrel for
the full-year 2012. is estimate is subject to many factors
and uncertainties, including quotas that may be imposed by
OPEC, price eects on entitlement volumes, changes in s-
cal terms or restrictions on the scope of company operations,
delays in project startups or ramp-ups, uctuations in demand
for natural gas in various markets, weather conditions that
may shut in production, civil unrest, changing geopolitics,
delays in completion of maintenance turnarounds, greater-
than-expected declines in production from mature elds,
or other disruptions to operations. e outlook for future
production levels is also aected by the size and number of
economic investment opportunities and, for new, large-scale
projects, the time lag between initial exploration and the
beginning of production. Investments in upstream projects
generally begin well in advance of the start of the associated
crude oil and natural gas production. A signicant majority
of Chevron’s upstream investment is made outside the United
States.
Refer to the “Results of Operations” section on pages
14 through 15 for additional discussion of the company’s
upstream business.
Refer to Table V beginning on page 76 for a tabulation of
the company’s proved net oil and gas reserves by geographic
area, at the beginning of 2010 and each year-end from 2010
through 2012, and an accompanying discussion of major
changes to proved reserves by geographic area for the three-
year period ending December 31, 2012.
On November 7, 2011, while drilling a development
well in the deepwater Frade Field about 75 miles oshore
Brazil, an unanticipated pressure spike caused oil to migrate
from the well bore through a series of ssures to the sea oor,
emitting approximately 2,400 barrels of oil. e source of
the seep was substantially contained within four days and
the well was plugged and abandoned. No evidence of any
coastal or wildlife impacts related to this seep has emerged.
On March 14, 2012, the company identied a small, second
seep in a dierent part of the eld. As a precautionary mea-
sure, the company and its partners decided to temporarily
suspend eld production and received approval from Brazil’s
National Petroleum Agency (ANP) to do so. Chevron and its
partners are cooperating with the Brazilian authorities. On
July 19, 2012, ANP issued its nal investigative report on the
November 2011 incident. A Brazilian federal district prosecu-
tor led two civil lawsuits seeking $10.7 billion in damages
for each of the two seeps. e company is not aware of any
basis for damages to be awarded in any civil lawsuit. On July
31, 2012, a court presiding over the civil litigation entered a
preliminary injunction barring Chevron from conducting oil
production and transportation activities in Brazil pending
completion of the legal proceedings commenced by the fed-
eral district prosecutor and the ongoing proceedings of ANP
and the Brazilian environment and natural resources regula-
tory agency. On September 28, 2012, the injunction was
modied to clarify that Chevron may continue its contain-
ment and mitigation activities under supervision of ANP. On
appeal, on November 27, 2012, the injunction was revoked
in its entirety. e federal district prosecutor also led crimi-
nal charges against 11 Chevron employees. Jurisdiction for
all three matters was moved from Campos to a court in Rio
de Janeiro. On February 19, 2013, the court dismissed the
criminal matter, which is subject to appeal by the prosecutor.
Chevron has submitted to ANP a plan for restarting limited
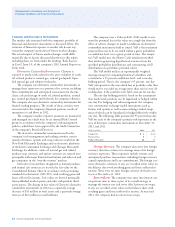
0.0
12.5
7.5
5.0
10.0
2.5
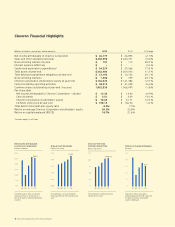
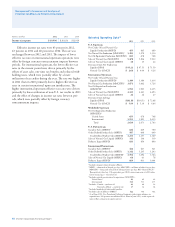
Net proved reserves for
consolidated companies and
affiliated companies increased
1 percent in 2012.
*2012, 2011, 2010 and 2009 include
barrels of oil-equivalent (BOE)
reserves for Canadian synthetic oil.
Net Proved Reserves
Billions of BOE*
United States
Other Americas
Africa
Asia
Australia
Europe
Affiliates
11.3
08 09
10
11
12
Net Proved Reserves
Liquids vs. Natural Gas
Billions of BOE
0908 10 11 12
11.3
Natural Gas
Liquids
12.5
7.5
0.0
10.0
5.0
2.5
Reserve replacement rate in 2012
was 112 percent.