Chevron 2012 Annual Report Download - page 22
Download and view the complete annual report
Please find page 22 of the 2012 Chevron annual report below. You can navigate through the pages in the report by either clicking on the pages listed below, or by using the keyword search tool below to find specific information within the annual report.-
 1
1 -
2
-
3
-
4
-
5
-
6
-
7
-
8
-
9
-
10
-
11
-
 12
12 -
 13
13 -
 14
14 -
 15
15 -
 16
16 -
 17
17 -
 18
18 -
 19
19 -
 20
20 -
 21
21 -
 22
22 -
 23
23 -
 24
24 -
 25
25 -
 26
26 -
 27
27 -
 28
28 -
 29
29 -
 30
30 -
 31
31 -
 32
32 -
33
-
34
-
35
-
36
-
37
-
38
-
39
-
40
-
41
-
42
-
43
-
44
-
45
-
46
-
47
-
48
-
49
-
50
-
51
-
52
-
53
-
54
-
55
-
56
-
57
-
58
-
59
-
60
-
61
-
62
-
63
-
64
-
65
-
66
-
67
-
68
-
69
-
70
-
71
-
72
-
73
-
74
-
75
-
76
-
77
-
78
-
79
-
80
-
81
-
82
-
83
-
84
-
85
-
86
-
87
-
88
-
89
-
90
-
91
-
92
 |
 |

Management’s Discussion and Analysis of
Financial Condition and Results of Operations
20 Chevron Corporation 2012 Annual Report
Management’s Discussion and Analysis of
Financial Condition and Results of Operations
2012, the company had purchased 97.7 million shares for
$10.0 billion.
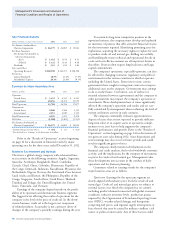
Capital and exploratory expenditures Total expendi-
tures for 2012 were $34.2 billion, including $2.1 billion for the
company’s share of equity-aliate expenditures. In 2011 and
2010, expenditures were $29.1 billion and $21.8 billion,
respectively, including the company’s share of aliates’ expen-
ditures of $1.7 billion and $1.4 billion, respectively.
Of the $34.2 billion of expenditures in 2012, 89 percent,
or $30.4 billion, was related to upstream activities. Approxi-
mately 89 percent and 87 percent were expended for
upstream operations in 2011 and 2010. International
upstream accounted for about 72 percent of the worldwide
upstream investment in 2012, about 68percent in 2011 and
about 82 percent in 2010. ese amounts exclude the acquisi-
tion of Atlas Energy, Inc., in 2011.
e company estimates that 2013 capital and exploratory
expenditures will be $36.7 billion, including $3.3 billion of
spending by aliates. Approximately 90 percent of thetotal,
or $33 billion, is budgeted for exploration and production
activities. Approximately $25.5 billion, or 77 percent, of
this amount is for projects outside the United States. Spending
in 2013 is primarily focused on major development projects
in Angola, Australia, Brazil, Canada, China, Kazakhstan,
Nigeria, Republic of Congo, Russia, the United Kingdom
and the U.S. Gulf of Mexico. Also included is funding for
enhancing recovery and mitigating natural eld declines for
currently-producing assets, and for focused exploration and
appraisal activities.
Worldwide downstream spending in 2013 is estimated at
$2.7 billion, with about $1.4 billion for projects in the United
States. Major capital outlays include projects under construc-
tion at reneries in the United States, expansion of additives
production capacity in Singapore and chemicals projects in
the United States.
Investments in technology companies, power genera-
tion and other corporate businesses in 2013 are budgeted at
$1 billion.
Noncontrolling interests e company had noncon-
trolling interests of $1,308 million and $799 million at
December 31, 2012 and 2011, respectively. Distributions to
noncontrolling interests totaled $41 million and $71 million
in 2012 and 2011, respectively.
Pension Obligations Information related to pension
plan contributions is included on page 62 in Note 20 to
the Consolidated Financial Statements under the heading
“Cash Contributions and Benet Payments.” Refer also to
the discussion of pension accounting in “Critical Accounting
Estimates and Assumptions,” beginning on page 24.
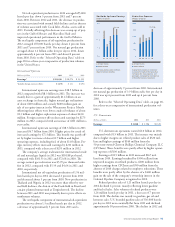
0.0
12.0
9.0
3.0
6.0
Percent
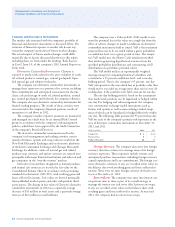
The ratio increased to 8.2 percent
at the end of 2012 due to higher
debt, partially offset by an increase
in Stockholders’ Equity.
Ratio of Total Debt to Total
Debt-Plus-Chevron Corporation
Stockholders’ Equity
0908 10 11 12
8.2%
0.0
32.0
16.0
24.0
8.0
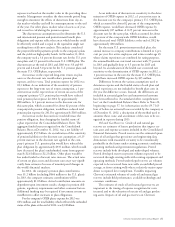
Upstream —
Capital & Exploratory
Expenditures*
Billions of dollars
United States
International
Exploration and production
expenditures were 18 percent
higher than 2011.
* Includes equity in affiliates.
Excludes the acquisition of Atlas
Energy, Inc., in 2011.
0908 10 11 12
$30.4
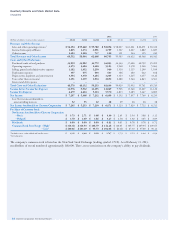
Capital and Exploratory Expenditures
2012 2011 2010
Millions of dollars U.S. Int’l. Total U.S. Int’l. Total U.S. Int’l. Total
Upstream1 $ 8,531 $ 21,913 $ 30,444 $ 8,318 $ 17,554 $ 25,872 $ 3,450 $ 15,454 $ 18,904
Downstream 1,913 1,259 3,172 1,461 1,150 2,611 1,456 1,096 2,552
All Other 602 11 613 575 8 583 286 13 299
Total $ 11,046 $ 23,183 $ 34,229 $ 10,354 $ 18,712 $ 29,066 $ 5,192 $ 16,563 $ 21,755
Total, Excluding Equity in Aliates $ 10,738 $ 21,374 $ 32,112 $ 10,077 $ 17,294 $ 27,371 $ 4,934 $ 15,433 $ 20,367
1 Excludes the acquisition of Atlas Energy, Inc., in 2011.