Chevron 2012 Annual Report Download - page 21
Download and view the complete annual report
Please find page 21 of the 2012 Chevron annual report below. You can navigate through the pages in the report by either clicking on the pages listed below, or by using the keyword search tool below to find specific information within the annual report.-
 1
1 -
2
-
3
-
4
-
5
-
6
-
7
-
8
-
9
-
10
-
 11
11 -
 12
12 -
 13
13 -
 14
14 -
 15
15 -
 16
16 -
 17
17 -
 18
18 -
 19
19 -
 20
20 -
 21
21 -
 22
22 -
 23
23 -
 24
24 -
 25
25 -
 26
26 -
 27
27 -
 28
28 -
 29
29 -
 30
30 -
 31
31 -
32
-
33
-
34
-
35
-
36
-
37
-
38
-
39
-
40
-
41
-
42
-
43
-
44
-
45
-
46
-
47
-
48
-
49
-
50
-
51
-
52
-
53
-
54
-
55
-
56
-
57
-
58
-
59
-
60
-
61
-
62
-
63
-
64
-
65
-
66
-
67
-
68
-
69
-
70
-
71
-
72
-
73
-
74
-
75
-
76
-
77
-
78
-
79
-
80
-
81
-
82
-
83
-
84
-
85
-
86
-
87
-
88
-
89
-
90
-
91
-
92
 |
 |
Chevron Corporation 2012 Annual Report 19
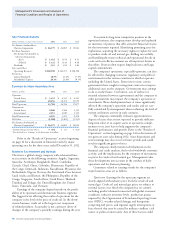
Liquidity and Capital Resources
Cash, cash equivalents, time deposits and marketable
securities Total balances were $21.9 billion and $20.1 bil-
lion at December 31, 2012 and 2011, respectively. Cash
provided byoperating activities in 2012 was $38.8 billion,
compared with $41.1 billion in 2011 and $31.4 billion in
2010. Cash provided by operating activities was net of contri-
butions to employee pension plans of approximately
$1.2 billion, $1.5 billion and $1.4 billion in 2012, 2011 and
2010, respectively. Cash provided by investing activities
included proceeds and deposits related to asset sales of
$2.7 billion in 2012, $3.5 billion in 2011, and $2.0billion in
2010.
Restricted cash of $1.5 billion and $1.2 billion associated
with tax payments, upstream abandonment activities, funds
held in escrow for an asset acquisition and capital investment
projects at December 31, 2012 and 2011, respectively, was
invested in short-term marketable securities and recorded as
“Deferred charges and other assets” on the Consolidated Balance
Sheet.
Dividends Dividends paid to common stockholders
were $6.8 billion in 2012, $6.1 billion in 2011 and $5.7
billion in 2010. In April 2012, the company increased its
quarterly dividend by 11.1 percent to 90 cents per common
share.
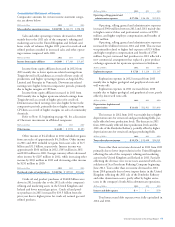
Debt and capital lease obligations Total debt and capi-
tal lease obligations were $12.2 billion at December 31, 2012,
up from $10.2 billion at year-end 2011.
e $2.0 billion increase in total debt and capital lease
obligations during 2012 included the net eect of a $4 bil-
lion bond issuance and the early redemption of a $2 billion
bond due in March 2014. e company’s debt and capital
lease obligations due within one year, consisting primarily
of commercial paper, redeemable long-term obligations and
the current portion of long-term debt, totaled $6.0 billion at
December 31, 2012, compared with $5.9 billion at year-end
2011. Of these amounts, $5.9 billion and $5.6 billion were
reclassied to long-term at the end of each period, respec-
tively. At year-end 2012, settlement of these obligations was
not expected to require the use of working capital in 2013, as
the company had the intent and the ability, as evidenced by
committed credit facilities, to renance them on a long-term
basis.
At December 31, 2012, the company had $6.0 billion in
committed credit facilities with various major banks, expiring
in December 2016, which enable the renancing of short-
term obligations on a long-term basis. ese facilities support
commercial paper borrowing and can also be used for gen-
eral corporate purposes. e company’s practice has been to
continually replace expiring commitments with new com-
mitments on substantially the same terms, maintaining levels
management believes appropriate. Any borrowings under the
facilities would be unsecured indebtedness at interest rates
based on the London Interbank Oered Rate or an average of
base lending rates published by specied banks and on terms
reecting the company’s strong credit rating. No borrowings
were outstanding under these facilities at December 31, 2012.
In addition, in November 2012, the company led with the
Securities and Exchange Commission a new registration
statement that expires in November 2015. is registration
statement is for an unspecied amount of nonconvertible
debt securities issued or guaranteed by the company.
e major debt rating agencies routinely evaluate the
company’s debt, and the company’s cost of borrowing can
increase or decrease depending on these debt ratings. e
company has outstanding public bonds issued by Chevron
Corporation, Chevron Corporation Prot Sharing/Sav-
ings Plan Trust Fund and Texaco Capital Inc. All of these
securities are the obligations of, or guaranteed by, Chevron
Corporation and are rated AA by Standard & Poor’s Corpo-
ration and Aa1 by Moody’s Investors Service. e company’s
U.S. commercial paper is rated A-1+ by Standard & Poor’s
and P-l by Moody’s. All of these ratings denote high-quality,
investment-grade securities.
e company’s future debt level is dependent primar-
ily on results of operations, the capital program and cash
that may be generated from asset dispositions. Based on its
high-quality debt ratings, the company believes that it has
substantial borrowing capacity to meet unanticipated cash
requirements. e company also can modify capital spending
plans during any extended periods of low prices for crude oil
and natural gas and narrow margins for rened products and
commodity chemicals to provide exibility to continue pay-
ing the common stock dividend and maintain the company’s
high-quality debt ratings.
Common stock repurchase program In July 2010, the
Board of Directors approved an ongoing share repurchase
program with no set term or monetary limits. e company
expects to repurchase between $500 million and $2 billion
of its common shares per quarter, at prevailing prices, as
permitted by securities laws and other legal requirements
and subject to market conditions and other factors. During
2012, the company purchased 46.6 million common shares
for $5.0 billion. From the inception of the program through
0.0
45.0
18.0
27.0
9.0
36.0
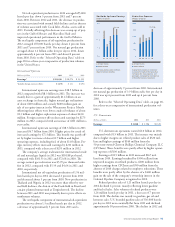
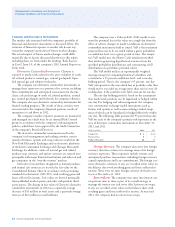
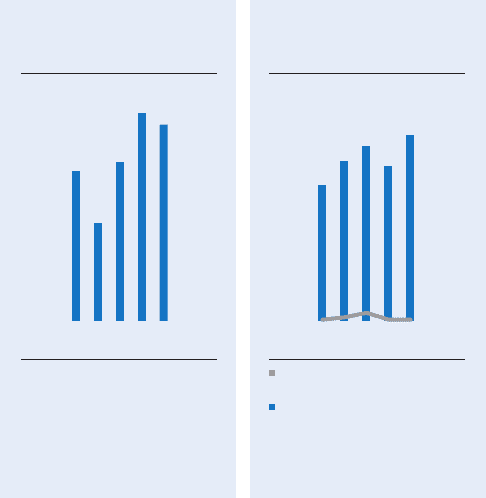
Cash Provided by
Operating Activities
Billions of dollars
Operating cash flows were $2.2
billion lower than 2011, primarily
due to lower benefits from working
capital and lower equity affiliate
distributions.
0908 10 11 12
$38.8
0.0
15.0
12.0
3.0
6.0
9.0
0.0
1.5
1.2
0.9
0.6
0.3
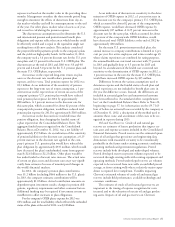
Total Interest Expense &
Total Debt at Year-End
Billions of dollars
Total Interest Expense
(right scale)
Total Debt (left scale)
Total debt increased $2.0 billion
during 2012 to $12.2 billion. All
interest expense was capitalized
as part of the cost of major
projects in 2012 and 2011.
$12.2
0908 10 11 12