Chevron 2012 Annual Report Download - page 62
Download and view the complete annual report
Please find page 62 of the 2012 Chevron annual report below. You can navigate through the pages in the report by either clicking on the pages listed below, or by using the keyword search tool below to find specific information within the annual report.-
 1
1 -
2
-
3
-
4
-
5
-
6
-
7
-
8
-
9
-
10
-
11
-
12
-
13
-
14
-
15
-
16
-
17
-
18
-
19
-
20
-
21
-
22
-
23
-
24
-
25
-
26
-
27
-
28
-
29
-
30
-
31
-
32
-
33
-
34
-
35
-
36
-
37
-
38
-
39
-
40
-
41
-
42
-
43
-
44
-
45
-
46
-
47
-
48
-
49
-
50
-
51
-
 52
52 -
 53
53 -
 54
54 -
 55
55 -
 56
56 -
 57
57 -
 58
58 -
 59
59 -
 60
60 -
 61
61 -
 62
62 -
 63
63 -
 64
64 -
 65
65 -
 66
66 -
 67
67 -
 68
68 -
 69
69 -
 70
70 -
 71
71 -
 72
72 -
73
-
74
-
75
-
76
-
77
-
78
-
79
-
80
-
81
-
82
-
83
-
84
-
85
-
86
-
87
-
88
-
89
-
90
-
91
-
92
 |
 |

60 Chevron Corporation 2012 Annual Report
Note 20 Employee Benefit Plans – Continued
Notes to the Consolidated Financial Statements
Millions of dollars, except per-share amounts
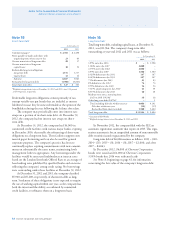
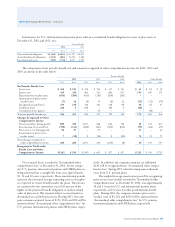
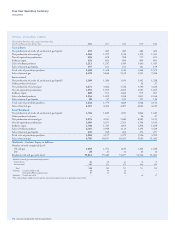
Assumptions e following weighted-average assumptions were used to determine benet obligations and net periodic benet
costs for years ended December 31:
Pension Benets
2012 2011 2010 Other Benets
U.S. Int’l. U.S. Int’l. U.S. Int’l. 2012 2011 2010
Assumptions used to determine
benet obligations:
Discount rate
3.6% 5.2% 3.8% 5.9% 4.8% 6.5% 4.1% 4.2% 5.2%
Rate of compensation increase 4.5% 5.5% 4.5% 5.7% 4.5% 6.7% N/A N/A N/A
Assumptions used to determine
net periodic benet cost:
Discount rate
3.8% 5.9% 4.8% 6.5% 5.3% 6.8% 4.2% 5.2% 5.9%
Expected return on plan assets 7.5% 7.5% 7.8% 7.8% 7.8% 7.8% N/A N/A N/A
Rate of compensation increase 4.5% 5.7% 4.5% 6.7% 4.5% 6.3% N/A N/A N/A
Expected Return on Plan Assets e company’s estimated
long-term rates of return on pension assets are driven pri-
marily by actual historical asset-class returns, an assessment
of expected future performance, advice from external actu-
arial rms and the incorporation of specic asset-class risk
factors. Asset allocations are periodically updated using pen-
sion plan asset/liability studies, and the company’s estimated
long-term rates of return are consistent with these studies.
For 2012, the company used an expected long-term rate
of return of 7.5 percent for U.S. pension plan assets, which
account for 70 percent of the company’s pension plan assets.
In 2011 and 2010, the company used a long-term rate of
return of 7.8 percent for this plan.
e market-related value of assets of the major U.S.
pension plan used in the determination of pension expense
was based on the market values in the three months preced-
ing the year-end measurement date. Management considers
the three-month time period long enough to minimize the
eects of distortions from day-to-day market volatility and
still be contemporaneous to the end of the year. For other
plans, market value of assets as of year-end is used in calcu-
lating the pension expense.
Discount Rate e discount rate assumptions used to
determine the U.S. and international pension and postretire-
ment benet plan obligations and expense reect the rate
at which benets could be eectively settled and is equal to
the equivalent single rate resulting from yield curve analysis.
is analysis considered the projected benet payments spe-
cic to the company’s plans and the yields on high-quality
bonds. At December 31, 2012, the company used a 3.6 per-
cent discount rate for the U.S. pension plans and 3.9 percent
for the main U.S. OPEB plan. e discount rates at the end
of 2011 and 2010 were 3.8 and 4.0 percent and 4.8 and 5.0
percent for the U.S. pension plans and the main U.S. OPEB
plans, respectively.
Other Benet Assumptions For the measurement of accu-
mulated postretirement benet obligation at December 31,
2012, for the main U.S. postretirement medical plan, the
assumed health care cost-trend rates start with 7.5 percent
in 2013 and gradually decline to 4.5 percent for 2025 and
beyond. For this measurement at December 31, 2011, the
assumed health care cost-trend rates started with 8 percent
in 2012 and gradually declined to 5 percent for 2023 and
beyond. In both measurements, the annual increase to com-
pany contributions was capped at 4 percent.
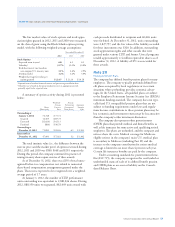
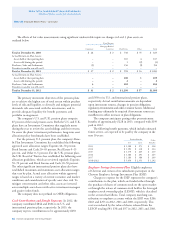
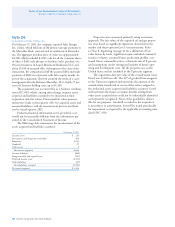
Assumed health care cost-trend rates can have a signi-
cant eect on the amounts reported for retiree health care
costs. e impact is mitigated by the 4 percent cap on the
company’s medical contributions for the primary U.S. plan.
A 1-percentage-point change in the assumed health care cost-
trend rates would have the following eects:
1 Percent 1 Percent
Increase Decrease
Eect on total service and interest cost components $ 16 $ (13)
Eect on postretirement benet obligation $ 165 $ (141)
Plan Assets and Investment Strategy e fair value hierar-
chy of inputs the company uses to value the pension assets is
divided into three levels:
Level 1: Fair values of these assets are measured using
unadjusted quoted prices for the assets or the prices of identical
assets in active markets that the plans have the ability toaccess.
Level 2: Fair values of these assets are measured based on
quoted prices for similar assets in active markets; quoted prices
for identical or similar assets in inactive markets; inputs other
than quoted prices that are observable for the asset; and inputs