Chevron 2012 Annual Report Download - page 76
Download and view the complete annual report
Please find page 76 of the 2012 Chevron annual report below. You can navigate through the pages in the report by either clicking on the pages listed below, or by using the keyword search tool below to find specific information within the annual report.-
 1
1 -
2
-
3
-
4
-
5
-
6
-
7
-
8
-
9
-
10
-
11
-
12
-
13
-
14
-
15
-
16
-
17
-
18
-
19
-
20
-
21
-
22
-
23
-
24
-
25
-
26
-
27
-
28
-
29
-
30
-
31
-
32
-
33
-
34
-
35
-
36
-
37
-
38
-
39
-
40
-
41
-
42
-
43
-
44
-
45
-
46
-
47
-
48
-
49
-
50
-
51
-
52
-
53
-
54
-
55
-
56
-
57
-
58
-
59
-
60
-
61
-
62
-
63
-
64
-
65
-
 66
66 -
 67
67 -
 68
68 -
 69
69 -
 70
70 -
 71
71 -
 72
72 -
 73
73 -
 74
74 -
 75
75 -
 76
76 -
 77
77 -
 78
78 -
 79
79 -
 80
80 -
 81
81 -
 82
82 -
 83
83 -
 84
84 -
 85
85 -
 86
86 -
87
-
88
-
89
-
90
-
91
-
92
 |
 |

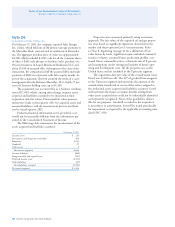
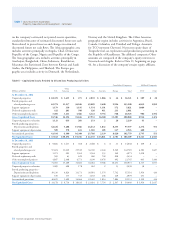
Table III Results of Operations for Oil and
Gas Producing Activities1
e company’s results of operations from oil and gas
producing activities for the years 2012, 2011 and 2010 are
shown in the following table. Net income from exploration
and production activities as reported on page 45 reects
income taxes computed on an eective rate basis.
Income taxes in Table III are based on statutory tax rates,
reecting allowable deductions and tax credits. Interest
income and expense are excluded from the results reported in
Table III and from the net income amounts on page 45.
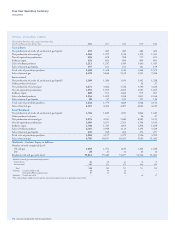
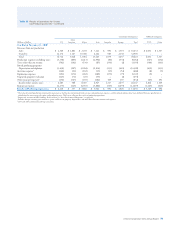
Table III – Results of Operations for Oil and Gas Producing Activities1
Consolidated Companies Aliated Companies
Other
Millions of dollars U.S. Americas Africa Asia Australia Europe Total TCO Other
Year Ended December 31, 2012
Revenues from net production
Sales $ 1,832 $ 1,561 $ 1,480 $ 10,485 $ 1,539 $ 1,618 $ 18,515 $ 7,869 $ 1,951
Transfers 15,122 1,997 15,033 9,071 1,073 2,148 44,444 – –
Total 16,954 3,558 16,513 19,556 2,612 3,766 62,959 7,869 1,951
Production expenses excluding taxes (4,009) (1,073) (1,918) (4,545) (164) (637) (12,346) (463) (442)
Taxes other than on income (654) (123) (161) (191) (390) (3) (1,522) (439) (767)
Proved producing properties:
Depreciation and depletion (3,462) (508) (2,475) (3,399) (315) (541) (10,700) (427) (147)
Accretion expense2
(226) (33) (66) (92) (23) (46) (486) (8) (6)
Exploration expenses (244) (145) (427) (489) (133) (272) (1,710) – –
Unproved properties valuation (127) (138) (16) (133) – (15) (429) – –
Other income (expense)3 167 (169) (199) 245 2,495 13 2,552 27 31
Results before income taxes 8,399 1,369 11,251 10,952 4,082 2,265 38,318 6,559 620
Income tax expense (3,043) (310) (7,558) (5,739) (1,226) (1,511) (19,387) (1,972) (299)
Results of Producing Operations $ 5,356 $ 1,059 $ 3,693 $ 5,213 $ 2,856 $ 754 $ 18,931 $ 4,587 $ 321
Year Ended December 31, 20114
Revenues from net production
Sales $ 2,508 $ 2,047 $ 1,174 $ 9,431 $ 1,474 $ 1,868 $ 18,502 $ 8,581 $ 1,988
Transfers 15,811 2,624 15,726 8,962 1,012 2,672 46,807 – –
Total 18,319 4,671 16,900 18,393 2,486 4,540 65,309 8,581 1,988
Production expenses excluding taxes (3,668) (1,061) (1,526) (4,489) (117) (564) (11,425) (449) (235)
Taxes other than on income (597) (137) (153) (242) (396) (2) (1,527) (429) (815)
Proved producing properties:
Depreciation and depletion (3,366) (796) (2,225) (2,923) (136) (580) (10,026) (442) (140)
Accretion expense2
(291) (27) (106) (81) (18) (39) (562) (8) (4)
Exploration expenses (207) (144) (188) (271) (128) (277) (1,215) – –
Unproved properties valuation (134) (146) (27) (60) – (14) (381) – –
Other income (expense)3 163 (466) (409) 231 (18) (74) (573) (8) (29)
Results before income taxes 10,219 1,894 12,266 10,558 1,673 2,990 39,600 7,245 765
Income tax expense (3,728) (535) (7,802) (5,374) (507) (1,913) (19,859) (2,176) (392)
Results of Producing Operations $ 6,491 $ 1,359 $ 4,464 $ 5,184 $ 1,166 $ 1,077 $ 19,741 $ 5,069 $ 373
1 e value of owned production consumed in operations as fuel has been eliminated from revenues and production expenses, and the related volumes have been deducted from net production in
calculating the unit average sales price and production cost. is has no eect on the results of producing operations.
2 Represents accretion of ARO liability. Refer to Note 23, “Asset Retirement Obligations,” on page 66.
3 Includes foreign currency gains and losses, gains and losses on property dispositions (primarily related to Browse and Wheatstone gains in 2012), and other miscellaneous income and expenses.
4 2011 and 2010 conformed to 2012 presentation.
74 Chevron Corporation 2012 Annual Report