Chevron 2012 Annual Report Download - page 50
Download and view the complete annual report
Please find page 50 of the 2012 Chevron annual report below. You can navigate through the pages in the report by either clicking on the pages listed below, or by using the keyword search tool below to find specific information within the annual report.-
 1
1 -
2
-
3
-
4
-
5
-
6
-
7
-
8
-
9
-
10
-
11
-
12
-
13
-
14
-
15
-
16
-
17
-
18
-
19
-
20
-
21
-
22
-
23
-
24
-
25
-
26
-
27
-
28
-
29
-
30
-
31
-
32
-
33
-
34
-
35
-
36
-
37
-
38
-
39
-
 40
40 -
 41
41 -
 42
42 -
 43
43 -
 44
44 -
 45
45 -
 46
46 -
 47
47 -
 48
48 -
 49
49 -
 50
50 -
 51
51 -
 52
52 -
 53
53 -
 54
54 -
 55
55 -
 56
56 -
 57
57 -
 58
58 -
 59
59 -
 60
60 -
61
-
62
-
63
-
64
-
65
-
66
-
67
-
68
-
69
-
70
-
71
-
72
-
73
-
74
-
75
-
76
-
77
-
78
-
79
-
80
-
81
-
82
-
83
-
84
-
85
-
86
-
87
-
88
-
89
-
90
-
91
-
92
 |
 |

48 Chevron Corporation 2012 Annual Report
Notes to the Consolidated Financial Statements
Millions of dollars, except per-share amounts
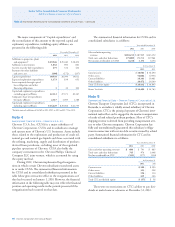
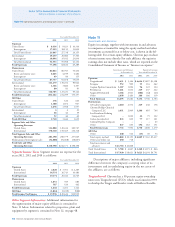
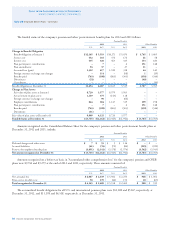
e following table provides summarized nancial information on a 100 percent basis for all equity affiliates as well as
Chevron’s total share, which includes Chevron loans to aliates of $1,494, $957 and $1,543 at December 31, 2012, 2011 and
2010, respectively.
Aliates Chevron Share
Year ended December 31 2012 2011 2010 2012 2011 2010
Total revenues $ 136,065 $ 140 ,107 $ 107,505 $ 65,196 $ 68,632 $ 52,088
Income before income tax expense 23,016 23,054 18,468 9,856 10,555 7,966
Net income attributable to aliates 16,786 16,663 12,831 6,938 7,413 5,683
At December 31
Current assets $ 37,541 $ 35,573 $ 30,335 $ 14,732 $ 14,695 $ 12,845
Noncurrent assets 66,065 61,855 57,491 23,523 22,422 21,401
Current liabilities 2 7, 8 78 24,671 20,428 11,093 11,040 9,363
Noncurrent liabilities 19,366 19,267 19,749 4,879 4,491 4,459
Total aliates’ net equity $ 56,362 $ 53,490 $ 47,649 $ 22,283 $ 21,586 $ 20,424
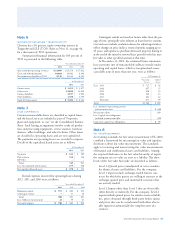
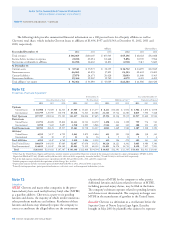
Note 12
Properties, Plant and Equipment1
At December 31 Year ended December 31
Gross Investment at Cost Net Investment Additions at Cost2,3 Depreciation Expense4
2012 2011 2010 2012 2011 2010 2012 2011 2010 2012 2011 2010
Upstream
United States $ 81,908 $ 74,369 $ 62,523
$ 37,909 $ 33,461 $ 23,277 $ 8,211 $ 14,404 $ 4,934 $ 3,902 $ 3,870 $ 4,078
International 145,799 125,795 110,578 85,318 72,543 64,388 21,343 15,722 14,381 8,015 7,590 7,448
Total Upstream 227,707 200,164 173,101 123,227 106,004 87,665 29,554 30,126 19,315 11,917 11,460 11,526
Downstream
United States 21,792 20,699 19,820 11,333 10,723 10,379 1,498 1,226 1,199 799 776 741
International 8,990 7,422 9,697 3,930 2,995 3,948 2,544 443 361 308 332 451
Total Downstream 30,782 28,121 29,517 15,263 13,718 14,327 4,042 1,669 1,560 1,107 1,108 1,192
All Other5
United States 4,959 5,117 4,722 2,845 2,872 2,496 415 591 259 384 338 341
International 33 30 27 13 14 16 4 5 11 5 5 4
Total All Other 4,992 5,147 4,749 2,858 2,886 2,512 419 596 270 389 343 345
Total United States 108,659 100,185 87,065 52,087 47,056 36,152 10,124 16,221 6,392 5,085 4,984 5,160
Total International 154,822 133,247 120,302 89,261 75,552 68,352 23,891 16,170 14,753 8,328 7,927 7,903
Total $ 263,481 $ 233,432 $ 207,367 $ 141,348 $ 122,608 $ 104,504 $ 34,015 $ 32,391 $ 21,145 $ 13,413 $ 12,911 $ 13,063
1 Other than the United States, Nigeria and Australia, no other country accounted for 10 percent or more of the company’s net properties, plant and equipment (PP&E) in 2012.
Nigeria had PP&E of $17,485, $15,601 and $13,896 for 2012, 2011 and 2010, respectively. Australia had $21,770 and $12,423 in 2012 and 2011 respectively.
2 Net of dry hole expense related to prior years’ expenditures of $80, $45 and $82 in 2012, 2011 and 2010, respectively.
3 Includes properties acquired with the acquisition of Atlas Energy, Inc., in 2011.
4 Depreciation expense includes accretion expense of $629, $628 and $513 in 2012, 2011 and 2010, respectively.
5 Primarily mining operations, power generation businesses, real estate assets and management information systems.
Note 13
Litigation
MTBE Chevron and many other companies in the petro-
leum industry have used methyl tertiary butyl ether (MTBE)
as a gasoline additive. Chevron is a party to six pending
lawsuits and claims, the majority of which involve numerous
other petroleum marketers and reners. Resolution of these
lawsuits and claims may ultimately require the company to
correct or ameliorate the alleged eects on the environment
of prior release of MTBE by the company or other parties.
Additional lawsuits and claims related to the use of MTBE,
including personal-injury claims, may be led in the future.
e company’s ultimate exposure related to pending lawsuits
and claims is not determinable. e company no longer uses
MTBE in the manufacture of gasoline in the United States.
Ecuador Chevron is a defendant in a civil lawsuit before the
Superior Court of Nueva Loja in Lago Agrio, Ecuador,
brought in May 2003 by plaintis who claim to be represen-
Note 11 Investment and Advances – Continued