Chevron 2012 Annual Report Download - page 47
Download and view the complete annual report
Please find page 47 of the 2012 Chevron annual report below. You can navigate through the pages in the report by either clicking on the pages listed below, or by using the keyword search tool below to find specific information within the annual report.-
 1
1 -
2
-
3
-
4
-
5
-
6
-
7
-
8
-
9
-
10
-
11
-
12
-
13
-
14
-
15
-
16
-
17
-
18
-
19
-
20
-
21
-
22
-
23
-
24
-
25
-
26
-
27
-
28
-
29
-
30
-
31
-
32
-
33
-
34
-
35
-
36
-
 37
37 -
 38
38 -
 39
39 -
 40
40 -
 41
41 -
 42
42 -
 43
43 -
 44
44 -
 45
45 -
 46
46 -
 47
47 -
 48
48 -
 49
49 -
 50
50 -
 51
51 -
 52
52 -
 53
53 -
 54
54 -
 55
55 -
 56
56 -
 57
57 -
58
-
59
-
60
-
61
-
62
-
63
-
64
-
65
-
66
-
67
-
68
-
69
-
70
-
71
-
72
-
73
-
74
-
75
-
76
-
77
-
78
-
79
-
80
-
81
-
82
-
83
-
84
-
85
-
86
-
87
-
88
-
89
-
90
-
91
-
92
 |
 |

Chevron Corporation 2012 Annual Report 45
Segment managers for the reportable segments are
directly accountable to and maintain regular contact with the
company’s CODM to discuss the segment’s operating activities
and nancial performance. e CODM approves annual
capital and exploratory budgets at the reportable segment level,
as well as reviews capital and exploratory funding for major
projects and approves major changes to the annual capital and
exploratory budgets. However, business-unit managers within
the operating segments are directly responsible for decisions
relating to project implementation and all other matters con-
nected with daily operations. Company ocers who are
members of the EXCOM also have individual management
responsibilities and participate in other committees for pur-
poses other than acting as the CODM.
e company’s primary country of operation is the
United States of America, its country of domicile. Other
components of the company’s operations are reported as
“International” (outside the United States).
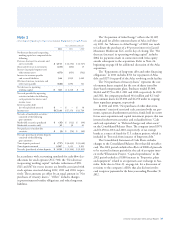
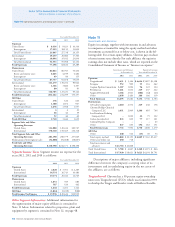
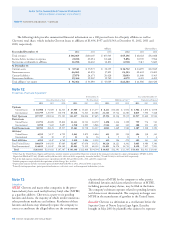
Segment Earnings e company evaluates the performance
of its operating segments on an after-tax basis, without con-
sidering the eects of debt nancing interest expense or
investment interest income, both of which are managed by the
company on a worldwide basis. Corporate administrative
costs and assets are not allocated to the operating segments.
However, operating segments are billed for the direct use of
corporate services. Nonbillable costs remain at the corporate
level in “All Other.” Earnings by major operating area are
presented in the following table:
Year ended December 31
2012 2011 2010
Segment Earnings
Upstream
United States $ 5,332 $ 6,512 $ 4,122
International 18,456 18,274 13,555
Total Upstream 23,788 24,786 17,677
Downstream
United States 2,048 1,506 1,339
International 2,251 2,085 1,139
Total Downstream 4,299 3,591 2,478
Total Segment Earnings 28,087 28,377 20,155
All Other
Interest expense – – (41)
Interest income 83 78 70
Other (1,991) (1,560) (1,160)
Net Income Attributable
to Chevron Corporation $ 26,179 $ 26,895 $ 19,024
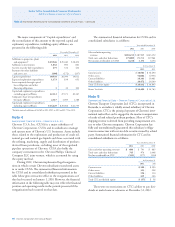
Segment Assets Segment assets do not include intercompany
investments or intercompany receivables. Segment assets at
year-end 2012 and 2011 are as follows:
At December 31
2012 2011
Upstream
United States $ 41,891 $ 37,108
International 115,806 98,540
Goodwill 4,640 4,642
Total Upstream 162,337 140,290
Downstream
United States 23,023 22,182
International 20,024 20,517
Total Downstream 43,047 42,699
Total Segment Assets 205,384 182,989
All Other*
United States 7,727 8,824
International 19,871 17,661
Total All Other 27,598 26,485
Total Assets – United States 72,641 68,114
Total Assets – International 155,701 136,718
Goodwill 4,640 4,642
Total Assets $ 232,982 $ 209,474
* “All Other” assets consist primarily of worldwide cash, cash equivalents, time
deposits and marketable securities, real estate, energy services, information sys-
tems, mining operations, power generation businesses, alternative fuels, technology
companies, and assets of the corporate administrative functions.
Segment Sales and Other Operating Revenues Operat-
ing segment sales and other operating revenues, including
internal transfers, for the years 2012, 2011 and 2010, are
presented in the table that follows. Products are transferred
between operating segments at internal product values that
approximate market prices.
Revenues for the upstream segment are derived primarily
from the production and sale of crude oil and natural gas,
as well as the sale of third-party production of natural gas.
Revenues for the downstream segment are derived from the
rening and marketing of petroleum products such as gaso-
line, jet fuel, gas oils, lubricants, residual fuel oils and
other products derived from crude oil. is segment also
generates revenues from the manufacture and sale of addi-
tives for fuels and lubricant oils and the transportation and
trading of rened products, crude oil and natural gas liquids.
“All Other” activities include revenues from mining opera-
tions, power generation businesses, insurance operations, real
estate activities, energy services, alternative fuels, and tech-
nology companies.
Note 10 Operating Segments and Geographic Data – Continued