Chevron 2012 Annual Report Download - page 36
Download and view the complete annual report
Please find page 36 of the 2012 Chevron annual report below. You can navigate through the pages in the report by either clicking on the pages listed below, or by using the keyword search tool below to find specific information within the annual report.-
 1
1 -
2
-
3
-
4
-
5
-
6
-
7
-
8
-
9
-
10
-
11
-
12
-
13
-
14
-
15
-
16
-
17
-
18
-
19
-
20
-
21
-
22
-
23
-
24
-
25
-
 26
26 -
 27
27 -
 28
28 -
 29
29 -
 30
30 -
 31
31 -
 32
32 -
 33
33 -
 34
34 -
 35
35 -
 36
36 -
 37
37 -
 38
38 -
 39
39 -
 40
40 -
 41
41 -
 42
42 -
 43
43 -
 44
44 -
 45
45 -
 46
46 -
47
-
48
-
49
-
50
-
51
-
52
-
53
-
54
-
55
-
56
-
57
-
58
-
59
-
60
-
61
-
62
-
63
-
64
-
65
-
66
-
67
-
68
-
69
-
70
-
71
-
72
-
73
-
74
-
75
-
76
-
77
-
78
-
79
-
80
-
81
-
82
-
83
-
84
-
85
-
86
-
87
-
88
-
89
-
90
-
91
-
92
 |
 |

34 Chevron Corporation 2012 Annual Report
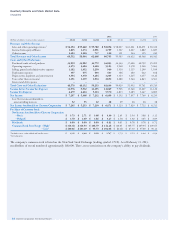
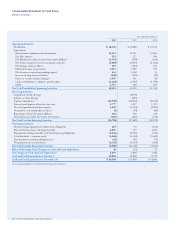
Consolidated Statement of Cash Flows
Millions of dollars
Year ended December 31
2012 2011 2010
Operating Activities
Net Income $ 26,336 $ 27,008 $ 19,136
Adjustments
Depreciation, depletion and amortization 13,413 12,911 13,063
Dry hole expense 555 377 496
Distributions less than income from equity affiliates (1,351) (570) (501)
Net before-tax gains on asset retirements and sales (4,089) (1,495) (1,004)
Net foreign currency eects 207 (103) 251
Deferred income tax provision 2,015 1,589 559
Net decrease in operating working capital 363 2,318 76
Increase in long-term receivables (169) (150) (12)
Decrease in other deferred charges 1,047 341 48
Cash contributions to employee pension plans (1,228) (1,467) (1,450)
Other 1,713 336 692
Net Cash Provided by Operating Activities 38,812 41,095 31,354
Investing Activities
Acquisition of Atlas Energy – (3,009) –
Advance to Atlas Energy – (403) –
Capital expenditures (30,938) (26,500) (19,612)
Proceeds and deposits related to asset sales 2,777 3,517 1,995
Net sales (purchases) of time deposits 3,250 (1,104) (2,855)
Net purchases of marketable securities (3) (74) (49)
Repayment of loans by equity aliates 328 339 338
Net purchases of other short-term investments (210) (255) (732)
Net Cash Used for Investing Activities (24,796) (27,489) (20,915)
Financing Activities
Net borrowings (payments) of short-term obligations 264 23 (212)
Proceeds from issuances of long-term debt 4,007 377 1,250
Repayments of long-term debt and other financing obligations (2,224) (2,769) (156)
Cash dividends – common stock (6,844) (6,136) (5,669)
Distributions to noncontrolling interests (41) (71) (72)
Net purchases of treasury shares (4,142) (3,193) (306)
Net Cash Used for Financing Activities (8,980) (11,769) (5,165)
Eect of Exchange Rate Changes on Cash and Cash Equivalents 39 (33) 70
Net Change in Cash and Cash Equivalents 5,075 1,804 5,344
Cash and Cash Equivalents at January 1 15,864 14,060 8,716
Cash and Cash Equivalents at December 31 $ 20,939 $ 15,864 $ 14,060
See accompanying Notes to the Consolidated Financial Statements.