Chevron 2012 Annual Report Download - page 17
Download and view the complete annual report
Please find page 17 of the 2012 Chevron annual report below. You can navigate through the pages in the report by either clicking on the pages listed below, or by using the keyword search tool below to find specific information within the annual report.-
 1
1 -
2
-
3
-
4
-
5
-
6
-
 7
7 -
 8
8 -
 9
9 -
 10
10 -
 11
11 -
 12
12 -
 13
13 -
 14
14 -
 15
15 -
 16
16 -
 17
17 -
 18
18 -
 19
19 -
 20
20 -
 21
21 -
 22
22 -
 23
23 -
 24
24 -
 25
25 -
 26
26 -
 27
27 -
28
-
29
-
30
-
31
-
32
-
33
-
34
-
35
-
36
-
37
-
38
-
39
-
40
-
41
-
42
-
43
-
44
-
45
-
46
-
47
-
48
-
49
-
50
-
51
-
52
-
53
-
54
-
55
-
56
-
57
-
58
-
59
-
60
-
61
-
62
-
63
-
64
-
65
-
66
-
67
-
68
-
69
-
70
-
71
-
72
-
73
-
74
-
75
-
76
-
77
-
78
-
79
-
80
-
81
-
82
-
83
-
84
-
85
-
86
-
87
-
88
-
89
-
90
-
91
-
92
 |
 |

Chevron Corporation 2012 Annual Report 15
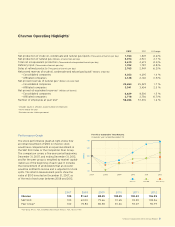
Net oil-equivalent production in 2012 averaged 655,000
barrels per day, down 3 percent from 2011 and 7 percent
from 2010. Between 2012 and 2011, the decrease in produc-
tion was associated with normal eld declines and an absence
of volumes associated with Cook Inlet, Alaska, assets sold in
2011. Partially osetting this decrease was a ramp-up of proj-
ects in the Gulf of Mexico and Marcellus Shale and
improved operational performance in the Gulf of Mexico.
e net liquids component of oil-equivalent production for
2012 averaged 455,000 barrels per day, down 2 percent from
2011 and 7 percent from 2010. Net natural gas production
averaged about 1.2 billion cubic feet per day in 2012, down
approximately 6 percent from 2011 and about 8 percent
from 2010. Refer to the “Selected Operating Data” table on
page 18 for a three-year comparative of production volumes
in the United States.
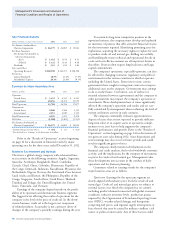
International Upstream
Millions of dollars 2012 2011 2010
Earnings* $ 18,456 $ 18,274 $ 13,555
*Includes foreign currency eects: $ (275) $ 211 $ (293)
International upstream earnings were $18.5 billion in
2012 compared with $18.3 billion in 2011. e increase was
mainly due to a gain of approximately $1.4 billion on an
asset exchange in Australia, higher natural gas realizations
of about $610 million and a nearly $600 million gain on
sale of an equity interest in the Wheatstone Project. Mostly
osetting these eects were lower crude oil volumes of about
$1.3 billion and higher exploration expenses of about $430
million. Foreign currency eects decreased earnings by $275
million in 2012, compared with an increase of $211 million a
year earlier.
International upstream earnings of $18.3 billion in 2011
increased $4.7 billion from 2010. Higher prices for crude oil
increased earnings by $7.1 billion. is benet was partly o-
set by higher tax items of about $1.7 billion and higher
operating expenses, including fuel, of about $1.0 billion. For-
eign currency eects increased earnings by $211 million in
2011, compared with a decrease of $293 million in 2012.
e company’s average realization for international crude
oil and natural gas liquids in 2012 was $101.88 per barrel,
compared with $101.53 in 2011 and $72.68 in 2010. e
average natural gas realization was $5.99 per thousand cubic
feet in 2012, compared with $5.39 and $4.64 in 2011 and
2010, respectively.
International net oil-equivalent production of 1.96 mil-
lion barrels per day in 2012 decreased 2 percent from 2011
and decreased about 5 percent from 2010. New production in
ailand and Nigeria in 2012 was more than oset by nor-
mal eld declines, the shut-in of the Frade eld in Brazil and
a major planned turnaround at Tengizchevroil. e decline
between 2011 and 2010 was primarily due to price eects on
entitlement volumes.
e net liquids component of international oil-equivalent
production was about 1.3 million barrels per day in 2012,
a decrease of approximately 5 percent from 2011 and a
decrease of approximately 9 percent from 2010. International
net natural gas production of 3.9 billion cubic feet per day in
2012 was up 6 percent from 2011 and up 4 percent from
2010.
Refer to the “Selected Operating Data” table, on page 18,
for a three-year comparative of international production vol-
umes.
U.S. Downstream
Millions of dollars 2012 2011 2010
Earnings $ 2,048 $ 1,506 $ 1,339
U.S. downstream operations earned $2.0 billion in 2012,
compared with $1.5 billion in 2011. e increase was mainly
due to higher margins on rened product sales of $520 mil-
lion and higher earnings of $140 million from the
50 percent-owned Chevron Phillips Chemical Company LLC
(CPChem). ese benets were partly oset by higher operat-
ing expenses of $130 million.
Earnings of $1.5 billion in 2011 increased $167 mil-
lion from 2010. Earnings beneted by $300 million from
improved margins on rened products, $200 million from
higher earnings from CPChem and $50 million from the
absence of 2010 charges related to employee reductions. ese
benets were partly oset by the absence of a $400 million
gain on the sale of the company’s ownership interest in the
Colonial Pipeline Company recognized in 2010.
Rened product sales of 1.21 million barrels per day in
2012 declined 4 percent, mainly reecting lower gasoline
and fuel oil sales. Sales volumes of rened products were
1.26 million barrels per day in 2011, a decrease of 7 percent
from 2010. e decline was mainly in gasoline, gas oil and
kerosene sales. U.S. branded gasoline sales of 516,000 barrels
per day in 2012 were essentially at from 2011 and declined
approximately 10 percent from 2010. e decline in 2012 and
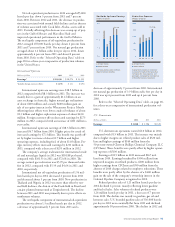
0
2000
1600
1200
800
400
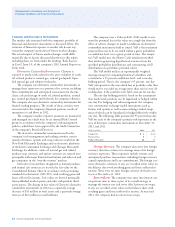
Exploration Expenses
Millions of dollars
United States
International
Exploration expenses increased
42 percent from 2011 mainly due
to higher dry hole expense and
geologic and geophysical expense
in the international segment.
0908 10 11 12
$1,728
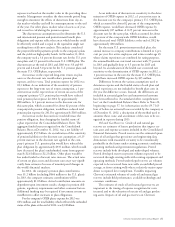
0.0
28.0
14.0
21.0
7.0
Worldwide Upstream Earnings
Billions of dollars
Earnings decreased in 2012 on
lower crude oil volumes.
United States
International
0908 10 11 12
$23.8