Chevron 2012 Annual Report Download - page 75
Download and view the complete annual report
Please find page 75 of the 2012 Chevron annual report below. You can navigate through the pages in the report by either clicking on the pages listed below, or by using the keyword search tool below to find specific information within the annual report.-
 1
1 -
2
-
3
-
4
-
5
-
6
-
7
-
8
-
9
-
10
-
11
-
12
-
13
-
14
-
15
-
16
-
17
-
18
-
19
-
20
-
21
-
22
-
23
-
24
-
25
-
26
-
27
-
28
-
29
-
30
-
31
-
32
-
33
-
34
-
35
-
36
-
37
-
38
-
39
-
40
-
41
-
42
-
43
-
44
-
45
-
46
-
47
-
48
-
49
-
50
-
51
-
52
-
53
-
54
-
55
-
56
-
57
-
58
-
59
-
60
-
61
-
62
-
63
-
64
-
 65
65 -
 66
66 -
 67
67 -
 68
68 -
 69
69 -
 70
70 -
 71
71 -
 72
72 -
 73
73 -
 74
74 -
 75
75 -
 76
76 -
 77
77 -
 78
78 -
 79
79 -
 80
80 -
 81
81 -
 82
82 -
 83
83 -
 84
84 -
 85
85 -
86
-
87
-
88
-
89
-
90
-
91
-
92
 |
 |

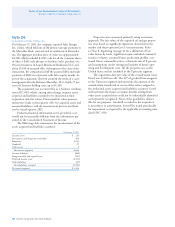
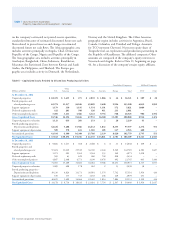
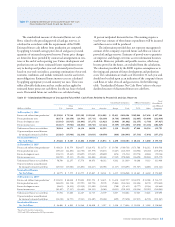
Consolidated Companies Aliated Companies
Other
Millions of dollars U.S. Americas Africa Asia Australia Europe Total TCO Other
At December 31, 2010
Unproved properties $ 2,553 $ 1,349 $ 359 $ 2,561 $ 6 $ 8 $ 6,836 $ 108 $ –
Proved properties and
related producing assets 55,601 7,747 23,683 33,316 2,585 9,035 131,967 6,512 1,594
Support equipment 975 265 1,282 1,421 259 165 4,367 985 –
Deferred exploratory wells 743 210 611 224 732 198 2,718 – –
Other uncompleted projects 2,299 3,844 4,061 3,627 3,631 362 17,824 357 1,001
Gross Capitalized Costs 62,171 13,415 29,996 41,149 7,213 9,768 163,712 7,962 2,595
Unproved properties valuation 967 436 150 200 2 – 1,755 34 –
Proved producing properties –
Depreciation and depletion 37,682 3,986 10,986 18,197 1,718 7,162 79,731 1,530 249
Support equipment depreciation 518 153 600 1,126 84 114 2,595 402 –
Accumulated provisions 39,167 4,575 11,736 19,523 1,804 7,276 84,081 1,966 249
Net Capitalized Costs $ 23,004 $ 8,840 $ 18,260 $ 21,626 $ 5,409 $ 2,492 $ 79,631 $ 5,996 $ 2,346
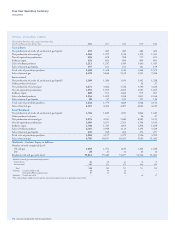
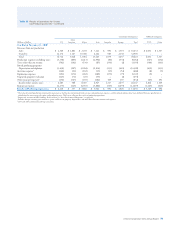
Table II Capitalized Costs Related to Oil and
Gas Producing Activities – Continued
Chevron Corporation 2012 Annual Report 73