Chevron 2012 Annual Report Download - page 72
Download and view the complete annual report
Please find page 72 of the 2012 Chevron annual report below. You can navigate through the pages in the report by either clicking on the pages listed below, or by using the keyword search tool below to find specific information within the annual report.-
 1
1 -
2
-
3
-
4
-
5
-
6
-
7
-
8
-
9
-
10
-
11
-
12
-
13
-
14
-
15
-
16
-
17
-
18
-
19
-
20
-
21
-
22
-
23
-
24
-
25
-
26
-
27
-
28
-
29
-
30
-
31
-
32
-
33
-
34
-
35
-
36
-
37
-
38
-
39
-
40
-
41
-
42
-
43
-
44
-
45
-
46
-
47
-
48
-
49
-
50
-
51
-
52
-
53
-
54
-
55
-
56
-
57
-
58
-
59
-
60
-
61
-
 62
62 -
 63
63 -
 64
64 -
 65
65 -
 66
66 -
 67
67 -
 68
68 -
 69
69 -
 70
70 -
 71
71 -
 72
72 -
 73
73 -
 74
74 -
 75
75 -
 76
76 -
 77
77 -
 78
78 -
 79
79 -
 80
80 -
 81
81 -
 82
82 -
83
-
84
-
85
-
86
-
87
-
88
-
89
-
90
-
91
-
92
 |
 |

70 Chevron Corporation 2012 Annual Report70 Chevron Corporation 2012 Annual Report
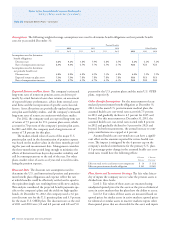
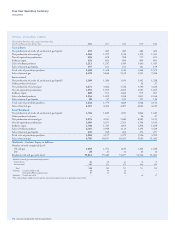
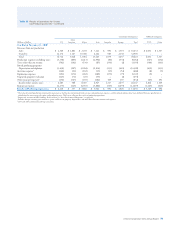
Five-Year Operating Summary
Unaudited
Worldwide – Includes Equity in Aliates
Thousands of barrels per day, except natural gas data,
which is millions of cubic feet per day 2012 2011 2010 2009 2008
United States
Net production of crude oil and natural gas liquids 455 465 489 484 421
Net production of natural gas1 1,203 1,279 1,314 1,399 1,501
Net oil-equivalent production 655 678 708 717 671
Renery input 833 854 890 899 891
Sales of rened products 1,211 1,257 1,349 1,403 1,413
Sales of natural gas liquids 157 161 161 161 159
Total sales of petroleum products 1,368 1,418 1,510 1,564 1,572
Sales of natural gas 5,470 5,836 5,932 5,901 7,226
International
Net production of crude oil and natural gas liquids2 1,309 1,384 1,434 1,362 1,228
Other produced volumes3 – – – 26 27
Net production of natural gas1 3,871 3,662 3,726 3,590 3,624
Net oil-equivalent production 1,955 1,995 2,055 1,987 1,859
Renery input 869 933 1,004 979 967
Sales of rened products 1,554 1,692 1,764 1,851 2,016
Sales of natural gas liquids 88 87 105 111 114
Total sales of petroleum products 1,642 1,779 1,869 1,962 2,130
Sales of natural gas 4,315 4,361 4,493 4,062 4,215
Total Worldwide
Net production of crude oil and natural gas liquids 1,764 1,849 1,923 1,846 1,649
Other produced volumes – – – 26 27
Net production of natural gas1 5,074 4,941 5,040 4,989 5,125
Net oil-equivalent production 2,610 2,673 2,763 2,704 2,530
Renery input 1,702 1,787 1,894 1,878 1,858
Sales of rened products 2,765 2,949 3,113 3,254 3,429
Sales of natural gas liquids 245 248 266 272 273
Total sales of petroleum products 3,010 3,197 3,379 3,526 3,702
Sales of natural gas 9,785 10,197 10,425 9,963 11,441
Worldwide – Excludes Equity in Aliates
Number of wells completed (net)4
Oil and gas 1,618 1,551 1,160 1,265 1,648
Dry 28 27 31 24 12
Productive oil and gas wells (net)4 55,812 55,049 51,677 51,326 51,262
1 Includes natural gas consumed in operations:
United States 63 69 62 58 70
International 523 513 475 463 450
Tot a l 586 582 537 521 520
2 Includes: Canada-synthetic oil 43 40 24 – –
Venezuela aliate-synthetic oil 17 32 28 – –
3 Includes: Canada oil sands – – – 26 27
4 Net wells include wholly owned and the sum of fractional interests in partially owned wells.