Chevron 2012 Annual Report Download - page 24
Download and view the complete annual report
Please find page 24 of the 2012 Chevron annual report below. You can navigate through the pages in the report by either clicking on the pages listed below, or by using the keyword search tool below to find specific information within the annual report.-
 1
1 -
2
-
3
-
4
-
5
-
6
-
7
-
8
-
9
-
10
-
11
-
12
-
13
-
 14
14 -
 15
15 -
 16
16 -
 17
17 -
 18
18 -
 19
19 -
 20
20 -
 21
21 -
 22
22 -
 23
23 -
 24
24 -
 25
25 -
 26
26 -
 27
27 -
 28
28 -
 29
29 -
 30
30 -
 31
31 -
 32
32 -
 33
33 -
 34
34 -
35
-
36
-
37
-
38
-
39
-
40
-
41
-
42
-
43
-
44
-
45
-
46
-
47
-
48
-
49
-
50
-
51
-
52
-
53
-
54
-
55
-
56
-
57
-
58
-
59
-
60
-
61
-
62
-
63
-
64
-
65
-
66
-
67
-
68
-
69
-
70
-
71
-
72
-
73
-
74
-
75
-
76
-
77
-
78
-
79
-
80
-
81
-
82
-
83
-
84
-
85
-
86
-
87
-
88
-
89
-
90
-
91
-
92
 |
 |

Management’s Discussion and Analysis of
Financial Condition and Results of Operations
22 Chevron Corporation 2012 Annual Report
Management’s Discussion and Analysis of
Financial Condition and Results of Operations
Financial and Derivative Instruments
e market risk associated with the company’s portfolio of
nancial and derivative instruments is discussed below. e
estimates of nancial exposure to market risk do not rep-
resent the company’s projection of future market changes.
e actual impact of future market changes could dier
materially due to factors discussed elsewhere in this report,
including those set forth under the heading “Risk Factors”
in Part I, Item 1A, of the company’s 2012 Annual Report on
Form 10-K.
Derivative Commodity Instruments Chevron is
exposed to market risks related to the price volatility of crude
oil, rened products, natural gas, natural gas liquids, lique-
ed natural gas and renery feedstocks.
e company uses derivative commodity instruments to
manage these exposures on a portion of its activity, including
rm commitments and anticipated transactions for the pur-
chase, sale and storage of crude oil, rened products, natural
gas, natural gas liquids and feedstock for company reneries.
e company also uses derivative commodity instruments for
limited trading purposes. e results of these activities were
not material to the company’s nancial position, results of
operations or cash ows in 2012.
e company’s market exposure positions are monitored
and managed on a daily basis by an internal Risk Control
group in accordance with the company’s risk management
policies, which have been approved by the Audit Committee
of the company’s Board of Directors.
e derivative commodity instruments used in the
company’s risk management and trading activities consist
mainly of futures, options and swap contracts traded on the
New York Mercantile Exchange and on electronic platforms
of the Inter-Continental Exchange and Chicago Mercantile
Exchange. In addition, crude oil, natural gas and rened
product swap contracts and option contracts are entered into
principally with major nancial institutions and other oil and
gas companies in the “over-the-counter” markets.
Derivatives beyond those designated as normal purchase
and normal sale contracts are recorded at fair value on the
Consolidated Balance Sheet in accordance with accounting
standards for derivatives (ASC 815), with resulting gains and
losses reected in income. Fair values are derived principally
from published market quotes and other independent third-
party quotes. e change in fair value of Chevron’s derivative
commodity instruments in 2012 was a quarterly average
decrease of $31 million in total assets and a quarterly average
increase of $12 million in total liabilities.
e company uses a Value-at-Risk (VaR) model to esti-
mate the potential loss in fair value on a single day from the
eect of adverse changes in market conditions on derivative
commodity instruments held or issued. VaR is the maximum
projected loss not to be exceeded within a given probability
or condence level over a given period of time. e compa-
ny’s VaR model uses the Monte Carlo simulation method
that involves generating hypothetical scenarios from the
specied probability distributions and constructing a full
distribution of a portfolio’s potential values.
e VaR model utilizes an exponentially weighted
moving average for computing historical volatilities and
correlations, a 95 percent condence level, and a one-day
holding period. at is, the company’s 95 percent, one-day
VaR corresponds to the unrealized loss in portfolio value that
would not be exceeded on average more than one in every 20
trading days, if the portfolio were held constant for one day.
e one-day holding period is based on the assumption
that market-risk positions can be liquidated or hedged within
one day. For hedging and risk management, the company
uses conventional exchange-traded instruments such as
futures and options as well as non-exchange-traded swaps,
most of which can be liquidated or hedged eectively within
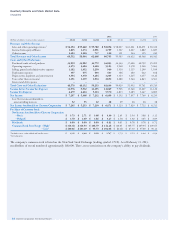
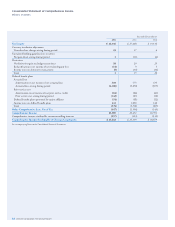
one day. e following table presents the 95 percent/one-day
VaR for each of the company’s primary risk exposures in the
area of derivative commodity instruments at December 31,
2012 and 2011.
Millions of dollars 2012 2011
Crude Oil $ 3 $ 22
Natural Gas 3 4
Rened Products 12 11
Foreign Currency e company may enter into foreign
currency derivative contracts to manage some of its foreign
currency exposures. ese exposures include revenue and
anticipated purchase transactions, including foreign currency
capital expenditures and lease commitments. e foreign cur-
rency derivative contracts, if any, are recorded at fair value on
the balance sheet with resulting gains and losses reected in
income. ere were no open foreign currency derivative con-
tracts at December 31, 2012.
Interest Rates e company may enter into interest rate
swaps from time to time as part of its overall strategy to
manage the interest rate risk on its debt. Interest rate swaps,
if any, are recorded at fair value on the balance sheet with
resulting gains and losses reected in income. At year-end
2012, the company had no interest rate swaps.