Chevron 2012 Annual Report Download - page 82
Download and view the complete annual report
Please find page 82 of the 2012 Chevron annual report below. You can navigate through the pages in the report by either clicking on the pages listed below, or by using the keyword search tool below to find specific information within the annual report.-
 1
1 -
2
-
3
-
4
-
5
-
6
-
7
-
8
-
9
-
10
-
11
-
12
-
13
-
14
-
15
-
16
-
17
-
18
-
19
-
20
-
21
-
22
-
23
-
24
-
25
-
26
-
27
-
28
-
29
-
30
-
31
-
32
-
33
-
34
-
35
-
36
-
37
-
38
-
39
-
40
-
41
-
42
-
43
-
44
-
45
-
46
-
47
-
48
-
49
-
50
-
51
-
52
-
53
-
54
-
55
-
56
-
57
-
58
-
59
-
60
-
61
-
62
-
63
-
64
-
65
-
66
-
67
-
68
-
69
-
70
-
71
-
 72
72 -
 73
73 -
 74
74 -
 75
75 -
 76
76 -
 77
77 -
 78
78 -
 79
79 -
 80
80 -
 81
81 -
 82
82 -
 83
83 -
 84
84 -
 85
85 -
 86
86 -
 87
87 -
 88
88 -
 89
89 -
 90
90 -
 91
91 -
 92
92
 |
 |

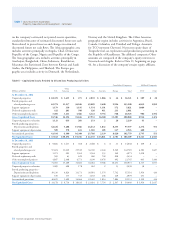
Noteworthy amounts in the categories of liquids proved
reserve changes for 2010 through 2012 are discussed below:
Revisions In 2010, net revisions increased reserves 82
million barrels. For consolidated companies, improved reser-
voir performance accounted for a majority of the 63 million
barrel increase in the United States. Increases in the other
regions were partially oset by Asia, which decreased as a
result of the eect of higher prices on entitlement volumes in
Kazakhstan. For aliated companies, the price eect on enti-
tlement volumes at TCO decreased reserves by33 million
barrels.
In 2011, net revisions increased reserves 235 million
barrels. For consolidated companies, improved reservoir
performance accounted for a majority of the 63 million bar-
rel increase in the United States. In Africa, improved eld
performance drove the 60 million barrel increase. In Asia,
increases from improved reservoir performance were partially
oset by the eects of higher prices on entitlement volumes.
Synthetic oil reserves in Canada increased by 32 million bar-
rels, primarily due to geotechnical revisions. For aliated
companies, improved facility and reservoir performance was
partially oset by the price eect on entitlement volumes at
TCO.
In 2012, net revisions increased reserves 390 million
barrels. Improved eld performance and drilling associated
with Gulf of Mexico projects accounted for the majority of
the 104 million barrel increase in the United States. In Asia,
drilling results across numerous assets drove the 97 million
barrel increase. Improved eld performance from various
Nigeria and Angola producing assets was primarily respon-
sible for the 66 million barrel increase in Africa. Improved
plant eciency for the TCO aliate was responsible for a
large portion of the 59 million barrel increase.
Improved Recovery In 2010, improved recovery
increased volumes by 77 million barrels. Reserves in Africa
increased 58 million barrels due primarily to secondary recov-
ery performance in Nigeria.
In 2011, improved recovery increased volumes by
58 million barrels. Reserves in Africa increased 48 million
barrels due primarily to secondary recovery performance in
Nigeria.
In 2012, improved recovery increased reserves by 77 mil-
lion barrels, primarily due to secondary recovery performance
in Africa and in Gulf of Mexico elds in the United States.
Extensions and Discoveries In 2010, extensions and dis-
coveries increased reserves 63 million barrels. e United States
and Other Americas each increased reserves 19 million barrels,
and Asia increased reserves 16 million barrels. No single area in
the United States was individually signicant. Drilling activ-
ity in Argentina and Brazil accounted for the majority of the
increase in Other Americas. In Asia, the increase was primarily
related to activity in Azerbaijan.
In 2011, extensions and discoveries increased reserves 299
million barrels. In the United States, additions related to two
Gulf of Mexico projects resulted in the majority of the 140
million barrel increase. In Australia, the Wheatstone Project
increased liquid volumes 65 million barrels. Africa and Other
Americas increased reserves 34 million and 30 million barrels,
respectively, following the start of new projects in these areas.
In Europe, a project in the United Kingdom increased reserves
26 million barrels.
In 2012, extensions and discoveries increased reserves 218
million barrels. In Other Americas, extensions and discover-
ies increased reserves 101 million barrels primarily due to the
initial booking of the Hebron project in Canada. In the United
States, additions at several Gulf of Mexico projects and drilling
activity in the mid-continent region were primarily responsible
for the 77 million barrel increase.
Purchases In 2011, purchases increased worldwide liq-
uid volumes 42 million barrels. e acquisition of additional
acreage in Canada increased synthetic oil reserves 40 million
barrels.
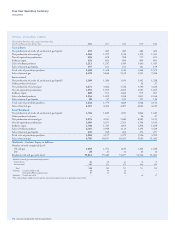
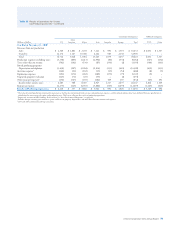
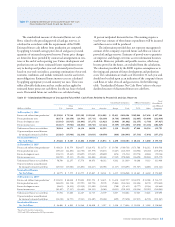
Table V Reserve Quantity Information – Continued
80 Chevron Corporation 2012 Annual Report