Chevron 2012 Annual Report Download - page 74
Download and view the complete annual report
Please find page 74 of the 2012 Chevron annual report below. You can navigate through the pages in the report by either clicking on the pages listed below, or by using the keyword search tool below to find specific information within the annual report.-
 1
1 -
2
-
3
-
4
-
5
-
6
-
7
-
8
-
9
-
10
-
11
-
12
-
13
-
14
-
15
-
16
-
17
-
18
-
19
-
20
-
21
-
22
-
23
-
24
-
25
-
26
-
27
-
28
-
29
-
30
-
31
-
32
-
33
-
34
-
35
-
36
-
37
-
38
-
39
-
40
-
41
-
42
-
43
-
44
-
45
-
46
-
47
-
48
-
49
-
50
-
51
-
52
-
53
-
54
-
55
-
56
-
57
-
58
-
59
-
60
-
61
-
62
-
63
-
 64
64 -
 65
65 -
 66
66 -
 67
67 -
 68
68 -
 69
69 -
 70
70 -
 71
71 -
 72
72 -
 73
73 -
 74
74 -
 75
75 -
 76
76 -
 77
77 -
 78
78 -
 79
79 -
 80
80 -
 81
81 -
 82
82 -
 83
83 -
 84
84 -
85
-
86
-
87
-
88
-
89
-
90
-
91
-
92
 |
 |

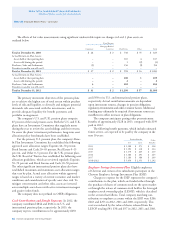
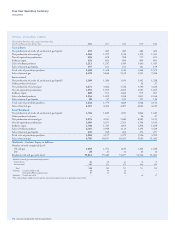
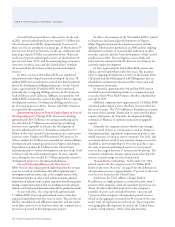
Table II – Capitalized Costs Related to Oil and Gas Producing Activities
Consolidated Companies Aliated Companies
Other
Millions of dollars U.S. Americas Africa Asia Australia Europe Total TCO Other
At December 31, 2012
Unproved properties $ 10,478 $ 1,415 $ 271 $ 2,039 $ 1,884 $ 34 $ 16,121 $ 109 $ 28
Proved properties and
related producing assets 62,274 11,237 30,106 39,889 2,420 9,994 155,920 6,832 1,852
Support equipment 1,179 330 1,195 1,554 1,191 172 5,621 1,089 –
Deferred exploratory wells 412 201 598 326 911 233 2,681 – –
Other uncompleted projects 7,203 3,211 3,466 4,123 9,754 768 28,525 906 1,594
Gross Capitalized Costs 81,546 16,394 35,636 47,931 16,160 11,201 208,868 8,936 3,474
Unproved properties valuation 1,121 634 201 253 2 28 2,239 41 –
Proved producing properties –
Depreciation and depletion 42,224 5,288 15,566 24,432 1,832 8,255 97,597 2,274 551
Support equipment depreciation 589 178 613 1,101 305 137 2,923 480 –
Accumulated provisions 43,934 6,100 16,380 25,786 2,139 8,420 102,759 2,795 551
Net Capitalized Costs $ 37,612 $ 10,294 $ 19,256 $ 22,145 $ 14,021 $ 2,781 $ 106,109 $ 6,141 $ 2,923
At December 31, 2011
Unproved properties $ 9,806 $ 1,417 $ 368 $ 2,408 $ 6 $ 33 $ 14,038 $ 109 $ –
Proved properties and
related producing assets 57,674 11,029 25,549 36,740 2,244 9,549 142,785 6,583 1,607
Support equipment 1,071 292 1,362 1,544 533 169 4,971 1,018 –
Deferred exploratory wells 565 63 629 260 709 208 2,434 – –
Other uncompleted projects 4,887 2,408 4,773 3,109 6,076 492 21,745 605 1,466
Gross Capitalized Costs 74,003 15,209 32,681 44,061 9,568 10,451 185,973 8,315 3,073
Unproved properties valuation 1,085 498 178 262 2 13 2,038 38 –
Proved producing properties –
Depreciation and depletion 39,210 4,826 13,173 20,991 1,574 7,742 87,516 1,910 436
Support equipment depreciation 530 175 715 1,192 238 129 2,979 451 –
Accumulated provisions 40,825 5,499 14,066 22,445 1,814 7,884 92,533 2,399 436
Net Capitalized Costs $ 33,178 $ 9,710 $ 18,615 $ 21,616 $ 7,754 $ 2,567 $ 93,440 $ 5,916 $ 2,637
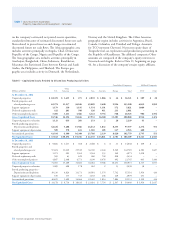
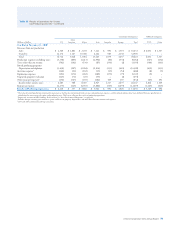
Table I Costs Incurred in Exploration,
Property Acquisitions and Development – Continued
on the company’s estimated net proved-reserve quantities,
stan dardized measure of estimated discounted future netcash
ows related to proved reserves and changes in estimated
discounted future net cash ows. e Africa geographic area
includes activities principally in Angola, Chad, Democratic
Republic of the Congo, Nigeria and Republic of the Congo.
e Asia geographic area includes activities principally in
Azerbaijan, Bangladesh, China, Indonesia, Kazakhstan,
Myanmar, the Partitioned Zone between Kuwait and Saudi
Arabia, the Philippines, and ailand. e Europe geo-
graphic area includes activity in Denmark, the Netherlands,
Norway and the United Kingdom. e Other Americas
geographic region includes activities in Argentina, Brazil,
Canada, Colombia, and Trinidad and Tobago. Amounts
for TCO represent Chevron’s 50 percent equity share of
Tengizchevroil, an exploration and production partnership in
the Republic of Kazakhstan. e aliated companies Other
amounts are composed of the company’s equity interests in
Venezuela and Angola. Refer to Note 11, beginning on page
46, for a dis cussion of thecompany’s major equity aliates.
72 Chevron Corporation 2012 Annual Report