Chevron 2012 Annual Report Download - page 13
Download and view the complete annual report
Please find page 13 of the 2012 Chevron annual report below. You can navigate through the pages in the report by either clicking on the pages listed below, or by using the keyword search tool below to find specific information within the annual report.-
 1
1 -
2
-
 3
3 -
 4
4 -
 5
5 -
 6
6 -
 7
7 -
 8
8 -
 9
9 -
 10
10 -
 11
11 -
 12
12 -
 13
13 -
 14
14 -
 15
15 -
 16
16 -
 17
17 -
 18
18 -
 19
19 -
 20
20 -
 21
21 -
 22
22 -
 23
23 -
24
-
25
-
26
-
27
-
28
-
29
-
30
-
31
-
32
-
33
-
34
-
35
-
36
-
37
-
38
-
39
-
40
-
41
-
42
-
43
-
44
-
45
-
46
-
47
-
48
-
49
-
50
-
51
-
52
-
53
-
54
-
55
-
56
-
57
-
58
-
59
-
60
-
61
-
62
-
63
-
64
-
65
-
66
-
67
-
68
-
69
-
70
-
71
-
72
-
73
-
74
-
75
-
76
-
77
-
78
-
79
-
80
-
81
-
82
-
83
-
84
-
85
-
86
-
87
-
88
-
89
-
90
-
91
-
92
 |
 |
Chevron Corporation 2012 Annual Report 11
also inhibit the company’s production capacity in an aected
region. e company closely monitors developments in the
countries in which it operates and holds investments, and
seeks to manage risks in operating its facilities and busi-
nesses. e longer-term trend in earnings for the upstream
segment is also a function of other factors, including the
company’s ability to nd or acquire and eciently produce
crude oil and natural gas, changes in scal terms of contracts,
and changes in tax laws and regulations.
e company continues to actively manage its schedule
of work, contracting, procurement and supply-chain activities
to eectively manage costs. However, price levels for capital
and exploratory costs and operating expenses associated with
the production of crude oil and natural gas can be subject
to external factors beyond the company’s control. External
factors include not only the general level of ination, but
also commodity prices and prices charged by the industry’s
material and service providers, which can be aected by the
volatility of the industry’s own supply-and-demand condi-
tions for such materials and services. Capital and exploratory
expenditures and operating expenses can also be aected by
damage to production facilities caused by severe weather or
civil unrest.
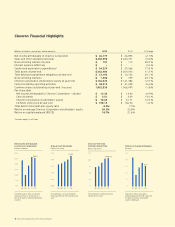
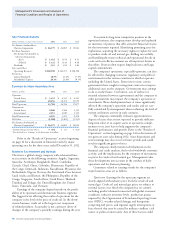
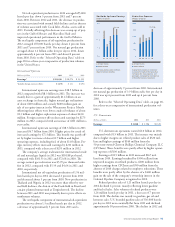
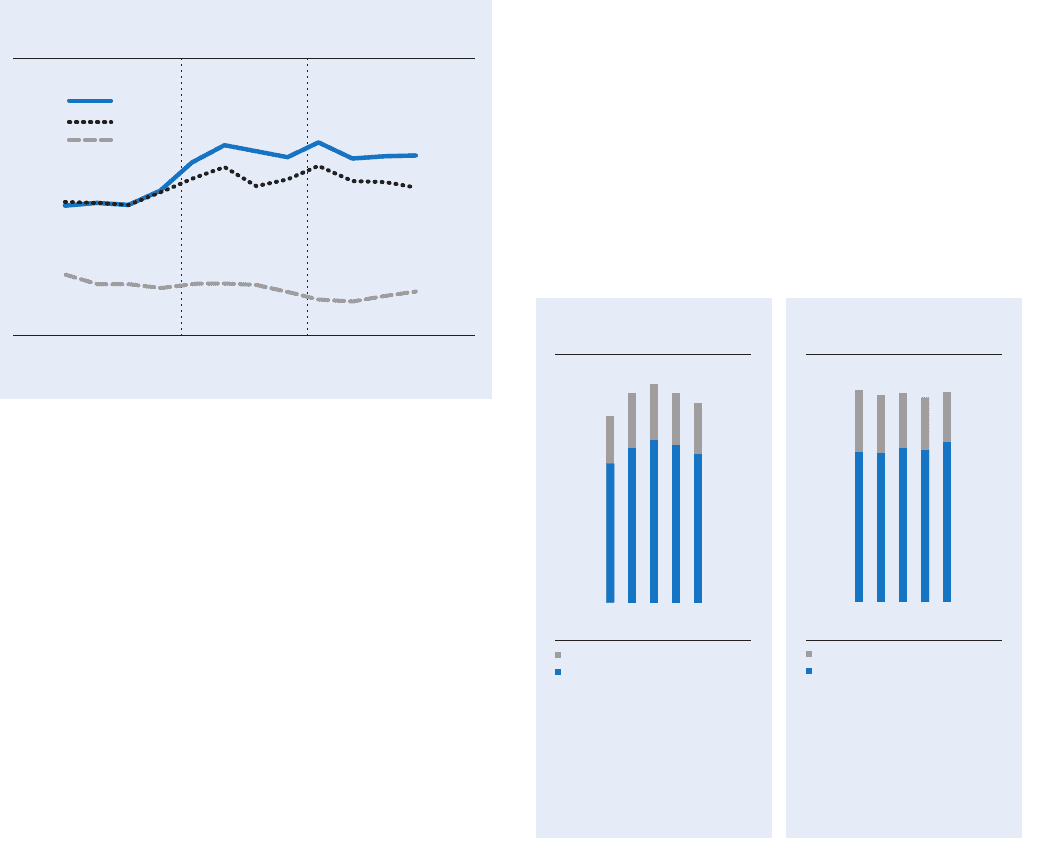
e chart above shows the trend in benchmark prices
for Brent crude oil, West Texas Intermediate (WTI) crude
oil and U.S. Henry Hub natural gas. e Brent price aver-
aged $112 per barrel for the full-year 2012, compared to
$111 in 2011. As of mid-February 2013, the Brent price was
about $118 per barrel. e majority of the company’s equity
crude production is priced based on the Brent benchmark.
e WTI price averaged $94 per barrel for the full-year
2012, compared to $95 in 2011. As of mid-February 2013,
the WTI price was about $97 per barrel. WTI traded at a
discount to Brent throughout 2012 due to high inventories
in the U.S. midcontinent market driven by strong growth in
domestic production.
A dierential in crude oil prices exists between high-
quality (high-gravity, low-sulfur) crudes and those of lower
quality (low-gravity, high-sulfur). e amount of the dif-
ferential in any period is associated with the supply of heavy
crude available versus the demand, which is a function of
the capacity of reneries that are able to process this lower
quality feedstock into light products (motor gasoline, jet
fuel, aviation gasoline and diesel fuel). During 2012, the dif-
ferential between U.S. light and heavy crude oil remained
below historical norms as light sweet crude oil production in
the midcontinent region increased and outbound capacity at
Cushing remained constrained. Outside of the U.S., the dif-
ferential narrowed modestly during 2012 as additional heavy
crude oil conversion capacity came on line.
Chevron produces or shares in the production of heavy
crude oil in California, Chad, Indonesia, the Partitioned
Zone between Saudi Arabia and Kuwait, Venezuela and in
certain elds in Angola, China and the United Kingdom
sector of the North Sea. (See page 18 for the company’s
average U.S. and international crude oil realizations.)
In contrast to price movements in the global market
for crude oil, price changes for natural gas in many regional
markets are more closely aligned with supply-and-demand
conditions in those markets. In the United States, prices at
Henry Hub averaged $2.71 per thousand cubic feet (MCF)
during 2012, compared with about $4.00 during 2011. As
of mid-February 2013, the Henry Hub spot price was about
$3.30 per MCF. Fluctuations in the price of natural gas
in the United States are closely associated with customer
demand relative to the volumes produced in North America.
Outside the United States, price changes for natural gas
depend on a wide range of supply, demand and regulatory
circumstances. In some locations, Chevron is investing in
long-term projects to install infrastructure to produce and
liquefy natural gas for transport by tanker to other markets.
International natural gas realizations averaged about $6.00
per MCF during 2012, compared with about $5.40 per MCF
during 2011. (See page 18 for the company’s average natural
gas realizations for the U.S. and international regions.)
WTI Crude Oil, Brent Crude Oil and Henry Hub Natural Gas Spot Prices —
Quarterly Average
0
60
150
120
90
30
0
10
25
20
15
5
1Q 2Q 3Q 4Q 1Q 1Q2Q 2Q3Q 3Q4Q 4Q
WTI/Brent
$/bbl
HH
$/mcf
2010 2011 2012
Brent
WTI
HH
0
5500
4400
1100
2200
3300
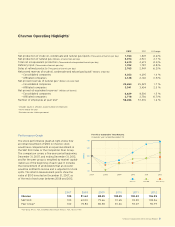
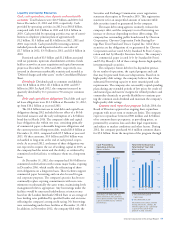
Net natural gas production increased
3 percent in 2012 mainly due to
increases in Thailand, Bangladesh
and the Marcellus Shale. Partially
offsetting the increases were field
declines in the United States,
Australia and the United Kingdom.
* Includes equity in affiliates.
Net Natural Gas Production*
Millions of cubic feet per day
United States
International
0908 10 11 12
5,074
0
2000
1600
1200
800
400
Net Liquids Production*
Thousands of barrels per day
United States
International
Net liquids production decreased
5 percent in 2012 mainly due to
field declines in the United States
and international locations, the
shut-in of the Frade Field in Brazil,
and a major planned turnaround at
Tengizchevroil.
* Includes equity in affiliates.
0908 10 11 12
1,764