Chevron 2012 Annual Report Download - page 63
Download and view the complete annual report
Please find page 63 of the 2012 Chevron annual report below. You can navigate through the pages in the report by either clicking on the pages listed below, or by using the keyword search tool below to find specific information within the annual report.-
 1
1 -
2
-
3
-
4
-
5
-
6
-
7
-
8
-
9
-
10
-
11
-
12
-
13
-
14
-
15
-
16
-
17
-
18
-
19
-
20
-
21
-
22
-
23
-
24
-
25
-
26
-
27
-
28
-
29
-
30
-
31
-
32
-
33
-
34
-
35
-
36
-
37
-
38
-
39
-
40
-
41
-
42
-
43
-
44
-
45
-
46
-
47
-
48
-
49
-
50
-
51
-
52
-
 53
53 -
 54
54 -
 55
55 -
 56
56 -
 57
57 -
 58
58 -
 59
59 -
 60
60 -
 61
61 -
 62
62 -
 63
63 -
 64
64 -
 65
65 -
 66
66 -
 67
67 -
 68
68 -
 69
69 -
 70
70 -
 71
71 -
 72
72 -
 73
73 -
74
-
75
-
76
-
77
-
78
-
79
-
80
-
81
-
82
-
83
-
84
-
85
-
86
-
87
-
88
-
89
-
90
-
91
-
92
 |
 |

Chevron Corporation 2012 Annual Report 61
Note 20 Employee Benefit Plans – Continued
that are derived principally from or corroborated by observ-
able market data through correlation or other means. If the
asset has a contractual term, the Level 2 input is observable
for substantially the full term of the asset. e fair values for
Level 2 assets are generally obtained from third-party broker
quotes, independent pricing services and exchanges.
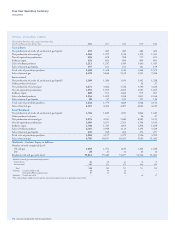
U.S. Int’l.
Total Fair Value Level 1 Level 2 Level 3 Total Fair Value Level 1 Level 2 Level 3
At December 31, 2011
Equities
U.S.1 $ 1,470 $ 1,470 $ – $ – $ 497 $ 497 $ – $ –
International 1,203 1,203 – – 693 693 – –
Collective Trusts/Mutual Funds2 2,633 14 2,619 – 596 28 568 –
Fixed Income
Government 622 146 476 – 635 25 610 –
Corporate 338 – 338 – 319 16 276 27
Mortgage-Backed Securities 107 – 107 – 2 – – 2
Other Asset Backed 61 – 61 – 5 – 5 –
Collective Trusts/Mutual Funds2 1,046 – 1,046 – 345 61 284 –
Mixed Funds3
10 10 – – 102 13 89 –
Real Estate4 843 – – 843 155 – – 155
Cash and Cash Equivalents 404 404 – – 211 211 – –
Other5
17 79 8 54 17 (2) 17 2
Total at December 31, 2011 $ 8,720 $ 3,168 $ 4,655 $ 897 $ 3,577 $ 1,542 $ 1,849 $ 186
At December 31, 2012
Equities
U.S.1 $ 1,709 $ 1,709 $ – $ – $ 334 $ 334 $ – $ –
International 1,263 1,263 – – 520 520 – –
Collective Trusts/Mutual Funds2 2,979 7 2,972 – 1,233 402 831 –
Fixed Income
Government 435 396 39 – 578 40 538 –
Corporate 384 – 384 – 230 25 175 30
Mortgage-Backed Securities 65 – 65 – 2 – – 2
Other Asset Backed 51 – 51 – 4 – 4 –
Collective Trusts/Mutual Funds2 1,520 – 1,520 – 671 26 645 –
Mixed Funds3
– – – – 115 4 111 –
Real Estate4 1,114 – – 1,114 177 – – 177
Cash and Cash Equivalents 373 373 – – 222 204 18 –
Other5
16 44 5 55 39 (3) 40 2
Total at December 31, 2012 $ 9,909 $ 3,704 $ 5,036 $ 1,169 $ 4,125 $ 1,552 $ 2,362 $ 211
1 U.S. equities include investments in the company’s common stock in the amount of $27 at December 31, 2012, and $35 at December 31, 2011.
2 Collective Trusts/Mutual Funds for U.S. plans are entirely index funds; for International plans, they are mostly index funds. For these index funds, the Level 2 designation is
partially based on the restriction that advance notication of redemptions, typically two business days, is required.
3 Mixed funds are composed of funds that invest in both equity and xed-income instruments in order to diversify and lower risk.
4 e year-end valuations of the U.S. real estate assets are based on internal appraisals by the real estate managers, which are updates of third-party appraisals that occur at least once
a year for each property in the portfolio.
5 e “Other” asset class includes net payables for securities purchased but not yet settled (Level 1); dividends and interest- and tax-related receivables (Level 2); insurance contracts
and investments in private-equity limited partnerships (Level 3).
Level 3: Inputs to the fair value measurement are
unobservable for these assets. Valuation may be performed
using a nancial model with estimated inputs entered into
themodel.
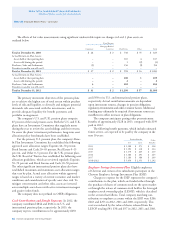
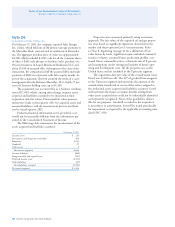
e fair value measurements of the company’s pen-
sion plans for 2012 and 2011 are below: