Chevron 2012 Annual Report Download - page 73
Download and view the complete annual report
Please find page 73 of the 2012 Chevron annual report below. You can navigate through the pages in the report by either clicking on the pages listed below, or by using the keyword search tool below to find specific information within the annual report.-
 1
1 -
2
-
3
-
4
-
5
-
6
-
7
-
8
-
9
-
10
-
11
-
12
-
13
-
14
-
15
-
16
-
17
-
18
-
19
-
20
-
21
-
22
-
23
-
24
-
25
-
26
-
27
-
28
-
29
-
30
-
31
-
32
-
33
-
34
-
35
-
36
-
37
-
38
-
39
-
40
-
41
-
42
-
43
-
44
-
45
-
46
-
47
-
48
-
49
-
50
-
51
-
52
-
53
-
54
-
55
-
56
-
57
-
58
-
59
-
60
-
61
-
62
-
 63
63 -
 64
64 -
 65
65 -
 66
66 -
 67
67 -
 68
68 -
 69
69 -
 70
70 -
 71
71 -
 72
72 -
 73
73 -
 74
74 -
 75
75 -
 76
76 -
 77
77 -
 78
78 -
 79
79 -
 80
80 -
 81
81 -
 82
82 -
 83
83 -
84
-
85
-
86
-
87
-
88
-
89
-
90
-
91
-
92
 |
 |

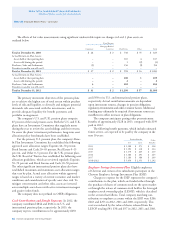
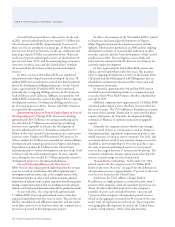
In accordance with FASB and SEC disclosure and reporting
requirements for oil and gas producing activities, this section
provides supplemental information on oil and gas exploration
and producing activities of the company in seven separate
tables. Tables I through IV provide historical cost informa-
tion pertaining to costs incurred in exploration, property
acquisitions and development; capitalized costs; and results
of operations. Tables V through VII present information
Supplemental Information on Oil and Gas Producing Activities
Unaudited
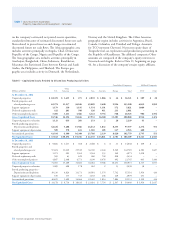
Table I – Costs Incurred in Exploration, Property Acquisitions and Development1
Consolidated Companies Aliated Companies
Other
Millions of dollars U.S. Americas Africa Asia Australia Europe Total TCO Other
Year Ended December 31, 2012
Exploration
Wells $ 251 $ 202 $ 121 $ 271 $ 302 $ 88 $ 1,235 $ – $ –
Geological and geophysical 99 105 107 86 47 58 502 – –
Rentals and other 161 55 93 201 85 107 702 – –
Total exploration 511 362 321 558 434 253 2,439 – –
Property acquisitions2
Proved 248 – 8 39 – – 295 – –
Unproved 1,150 29 5 342 28 – 1,554 – 28
Total property acquisitions 1,398 29 13 381 28 – 1,849 – 28
Development3 6,597 1,211 3,118 3,797 4,555 753 20,031 660 293
Total Costs Incurred4 $ 8,506 $ 1,602 $ 3,452 $ 4,736 $ 5,017 $ 1,006 $ 24,319 $ 660 $ 321
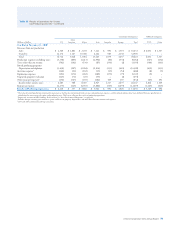
Year Ended December 31, 2011
Exploration
Wells $ 321 $ 71 $ 104 $ 146 $ 242 $ 188 $ 1,072 $ – $ –
Geological and geophysical 76 59 65 121 23 43 387 – –
Rentals and other 109 45 83 67 71 78 453 – –
Total exploration 506 175 252 334 336 309 1,912 – –
Property acquisitions2
Proved 1,174 16 – 1 – – 1,191 – –
Unproved 7,404 228 – – – 25 7,657 – –
Total property acquisitions 8,578 244 – 1 – 25 8,848 – –
Development3 5,517 1,537 2,698 2,867 2,638 633 15,890 379 368
Total Costs Incurred4 $ 14,601 $ 1,956 $ 2,950 $ 3,202 $ 2,974 $ 967 $ 26,650 $ 379 $ 368
Year Ended December 31, 2010
Exploration
Wells $ 99 $ 118 $ 94 $ 244 $ 293 $ 61 $ 909 $ – $ –
Geological and geophysical 67 46 87 29 8 18 255 – –
Rentals and other 121 39 55 47 95 57 414 – –
Total exploration 287 203 236 320 396 136 1,578 – –
Property acquisitions2
Proved 24 – – 129 – – 153 – –
Unproved 359 429 160 187 – 10 1,145 – –
Total property acquisitions 383 429 160 316 – 10 1,298 – –
Development3 4,446 1,611 2,985 3,325 2,623 411 15,401 230 343
Total Costs Incurred $ 5,116 $ 2,243 $ 3,381 $ 3,961 $ 3,019 $ 557 $ 18,277 $ 230 $ 343
1 Includes costs incurred whether capitalized or expensed. Excludes general support equipment expenditures. Includes capitalized amounts related to asset retirement obligations. SeeNote23,
“Asset Retirement Obligations,” on page 66.
2 Includes wells, equipment and facilities associated with proved reserves. Does not include properties acquired in nonmonetary transactions, such as $1,850 million related to the 2012 acquisi-
tion of Clio and Acme elds in Australia.
3 Includes $963, $1,035 and $745 costs incurred prior to assignment of proved reserves for consolidated companies in 2012, 2011 and 2010, respectively.
4 Reconciliation of consolidated and aliated companies total cost incurred to Upstream capital and exploratory (C&E) expenditures – $ billions.
Total cost incurred for 2012 $ 25.3
Non oil and gas activities 5.8 (Includes LNG and gas-to-liquids $4.6, transportation $0.6, aliate $0.4, other $0.2)
ARO (0.7)
Upstream C&E $ 30.4 Reference page 20 upstream total
Chevron Corporation 2012 Annual Report 71