XM Radio 2015 Annual Report Download - page 98
Download and view the complete annual report
Please find page 98 of the 2015 XM Radio annual report below. You can navigate through the pages in the report by either clicking on the pages listed below, or by using the keyword search tool below to find specific information within the annual report.-
 1
1 -
2
-
3
-
4
-
5
-
6
-
7
-
8
-
9
-
10
-
11
-
12
-
13
-
14
-
15
-
16
-
17
-
18
-
19
-
20
-
21
-
22
-
23
-
24
-
25
-
26
-
27
-
28
-
29
-
30
-
31
-
32
-
33
-
34
-
35
-
36
-
37
-
38
-
39
-
40
-
41
-
42
-
43
-
44
-
45
-
46
-
47
-
48
-
49
-
50
-
51
-
52
-
53
-
54
-
55
-
56
-
57
-
58
-
59
-
60
-
61
-
62
-
63
-
64
-
65
-
66
-
67
-
68
-
69
-
70
-
71
-
72
-
73
-
74
-
75
-
76
-
77
-
78
-
79
-
80
-
81
-
82
-
83
-
84
-
85
-
86
-
87
-
 88
88 -
 89
89 -
 90
90 -
 91
91 -
 92
92 -
 93
93 -
 94
94 -
 95
95 -
 96
96 -
 97
97 -
 98
98 -
 99
99 -
 100
100 -
 101
101 -
 102
102 -
 103
103 -
 104
104 -
 105
105 -
 106
106 -
 107
107 -
 108
108 -
109
-
110
-
111
-
112
-
113
-
114
-
115
-
116
-
117
-
118
-
119
-
120
-
121
-
122
-
123
-
124
-
125
-
126
-
127
-
128
-
129
-
130
-
131
-
132
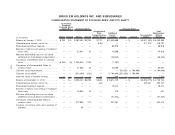
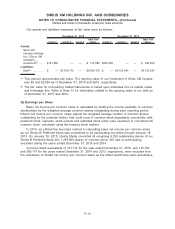
 |
 |

(in thousands) 2015 2014 2013
For the Years Ended December 31,
Cash flows from operating activities:
Net income . . . . . . . . . . . . . . . . . . . . . . . . . . . . . . . . . . . . . . . . . . $ 509,724 $ 493,241 $ 377,215
Adjustments to reconcile net income to net cash
provided by operating activities:
Depreciation and amortization . . . . . . . . . . . . . . . . . . . . 272,214 266,423 253,314
Non-cash interest expense, net of amortization of
premium. . . . . . . . . . . . . . . . . . . . . . . . . . . . . . . . . . . . . . . 7,872 21,039 21,698
Provision for doubtful accounts . . . . . . . . . . . . . . . . . . . 47,237 44,961 39,016
Amortization of deferred income related to equity
method investment. . . . . . . . . . . . . . . . . . . . . . . . . . . . . (2,776) (2,776) (2,776)
Loss on extinguishment of debt and credit
facilities, net . . . . . . . . . . . . . . . . . . . . . . . . . . . . . . . . . . . — — 190,577
Gain on unconsolidated entity investments, net . . . . — (5,547) (5,865)
Dividend received from unconsolidated entity
investment. . . . . . . . . . . . . . . . . . . . . . . . . . . . . . . . . . . . . 14,788 17,019 22,065
Loss on disposal of assets . . . . . . . . . . . . . . . . . . . . . . . 7,384 — —
Loss on change in value of derivatives. . . . . . . . . . . . — 34,485 20,393
Share-based payment expense . . . . . . . . . . . . . . . . . . . 84,310 78,212 68,876
Deferred income taxes . . . . . . . . . . . . . . . . . . . . . . . . . . . 365,499 327,461 259,787
Other non-cash purchase price adjustments . . . . . . . (1,394) (3,781) (207,854)
Changes in operating assets and liabilities:
Receivables . . . . . . . . . . . . . . . . . . . . . . . . . . . . . . . . . (61,440) (72,628) (15,245)
Inventory . . . . . . . . . . . . . . . . . . . . . . . . . . . . . . . . . . . . (2,898) (5,534) 11,474
Related party, net . . . . . . . . . . . . . . . . . . . . . . . . . . . (14,953) (4,303) 40
Prepaid expenses and other current assets . . . (67,204) (1,195) 16,788
Other long-term assets. . . . . . . . . . . . . . . . . . . . . . . (130,741) 3,393 3,324
Accounts payable and accrued expenses . . . . . 52,696 (17,191) (44,009)
Accrued interest . . . . . . . . . . . . . . . . . . . . . . . . . . . . . 11,215 38,355 8,131
Deferred revenue . . . . . . . . . . . . . . . . . . . . . . . . . . . . 145,242 48,645 73,593
Other long-term liabilities . . . . . . . . . . . . . . . . . . . . . 7,276 (7,035) 12,290
Net cash provided by operating activities . 1,244,051 1,253,244 1,102,832
Cash flows from investing activities:
Additions to property and equipment . . . . . . . . . . . . . . . . . . (134,892) (121,646) (173,617)
Purchases of restricted and other investments . . . . . . . . . (3,966) — (1,719)
Acquisition of business, net of cash acquired . . . . . . . . . . — 1,144 (525,352)
Return of capital from investment in unconsolidated
entity . . . . . . . . . . . . . . . . . . . . . . . . . . . . . . . . . . . . . . . . . . . . . . — 24,178 —
Net cash used in investing activities . . . . . . (138,858) (96,324) (700,688)
See accompanying notes to the consolidated financial statements.
F-7
SIRIUS XM HOLDINGS INC. AND SUBSIDIARIES
CONSOLIDATED STATEMENTS OF CASH FLOWS