XM Radio 2015 Annual Report Download - page 105
Download and view the complete annual report
Please find page 105 of the 2015 XM Radio annual report below. You can navigate through the pages in the report by either clicking on the pages listed below, or by using the keyword search tool below to find specific information within the annual report.-
 1
1 -
2
-
3
-
4
-
5
-
6
-
7
-
8
-
9
-
10
-
11
-
12
-
13
-
14
-
15
-
16
-
17
-
18
-
19
-
20
-
21
-
22
-
23
-
24
-
25
-
26
-
27
-
28
-
29
-
30
-
31
-
32
-
33
-
34
-
35
-
36
-
37
-
38
-
39
-
40
-
41
-
42
-
43
-
44
-
45
-
46
-
47
-
48
-
49
-
50
-
51
-
52
-
53
-
54
-
55
-
56
-
57
-
58
-
59
-
60
-
61
-
62
-
63
-
64
-
65
-
66
-
67
-
68
-
69
-
70
-
71
-
72
-
73
-
74
-
75
-
76
-
77
-
78
-
79
-
80
-
81
-
82
-
83
-
84
-
85
-
86
-
87
-
88
-
89
-
90
-
91
-
92
-
93
-
94
-
 95
95 -
 96
96 -
 97
97 -
 98
98 -
 99
99 -
 100
100 -
 101
101 -
 102
102 -
 103
103 -
 104
104 -
 105
105 -
 106
106 -
 107
107 -
 108
108 -
 109
109 -
 110
110 -
 111
111 -
 112
112 -
 113
113 -
 114
114 -
 115
115 -
116
-
117
-
118
-
119
-
120
-
121
-
122
-
123
-
124
-
125
-
126
-
127
-
128
-
129
-
130
-
131
-
132
 |
 |

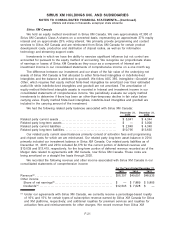
Our assets and liabilities measured at fair value were as follows:
Level 1 Level 2 Level 3
Total Fair
Value Level 1 Level 2 Level 3
Total Fair
Value
December 31, 2015 December 31, 2014
Assets:
Sirius XM
Canada Holdings
Inc. (“Sirius XM
Canada”)—
investment(a) . . . . . $141,850 — — $ 141,850 $246,500 — — $ 246,500
Liabilities:
Debt(b) . . . . . . . . . . . $ — $5,649,173 — $5,649,173 $ — $4,613,044 — $4,613,044
(a) This amount approximates fair value. The carrying value of our investment in Sirius XM Canada
was $0 and $2,654 as of December 31, 2015 and 2014, respectively.
(b) The fair value for non-publicly traded instruments is based upon estimates from a market maker
and brokerage firm. Refer to Note 13 for information related to the carrying value of our debt as
of December 31, 2015 and 2014.
(5) Earnings per Share
Basic net income per common share is calculated by dividing the income available to common
stockholders by the weighted average common shares outstanding during each reporting period.
Diluted net income per common share adjusts the weighted average number of common shares
outstanding for the potential dilution that could occur if common stock equivalents (convertible debt,
preferred stock, warrants, stock options and restricted stock units) were exercised or converted into
common stock, calculated using the treasury stock method.
In 2013, we utilized the two-class method in calculating basic net income per common share,
as our Series B Preferred Stock was considered to be participating securities through January 18,
2013. On January 18, 2013, Liberty Media converted its remaining 6,250 outstanding shares of our
Series B Preferred Stock into 1,293,509 shares of common stock. We had no participating
securities during the years ended December 31, 2015 and 2014.
Common stock equivalents of 151,112 for the year ended December 31, 2015, and 132,162
and 365,177 for the years ended December 31, 2014 and 2013, respectively, were excluded from
the calculation of diluted net income per common share as the effect would have been anti-dilutive.
F-14
SIRIUS XM HOLDINGS INC. AND SUBSIDIARIES
NOTES TO CONSOLIDATED FINANCIAL STATEMENTS—(Continued)
(Dollars and shares in thousands, except per share amounts)