XM Radio 2015 Annual Report Download - page 68
Download and view the complete annual report
Please find page 68 of the 2015 XM Radio annual report below. You can navigate through the pages in the report by either clicking on the pages listed below, or by using the keyword search tool below to find specific information within the annual report.-
 1
1 -
2
-
3
-
4
-
5
-
6
-
7
-
8
-
9
-
10
-
11
-
12
-
13
-
14
-
15
-
16
-
17
-
18
-
19
-
20
-
21
-
22
-
23
-
24
-
25
-
26
-
27
-
28
-
29
-
30
-
31
-
32
-
33
-
34
-
35
-
36
-
37
-
38
-
39
-
40
-
41
-
42
-
43
-
44
-
45
-
46
-
47
-
48
-
49
-
50
-
51
-
52
-
53
-
54
-
55
-
56
-
57
-
 58
58 -
 59
59 -
 60
60 -
 61
61 -
 62
62 -
 63
63 -
 64
64 -
 65
65 -
 66
66 -
 67
67 -
 68
68 -
 69
69 -
 70
70 -
 71
71 -
 72
72 -
 73
73 -
 74
74 -
 75
75 -
 76
76 -
 77
77 -
 78
78 -
79
-
80
-
81
-
82
-
83
-
84
-
85
-
86
-
87
-
88
-
89
-
90
-
91
-
92
-
93
-
94
-
95
-
96
-
97
-
98
-
99
-
100
-
101
-
102
-
103
-
104
-
105
-
106
-
107
-
108
-
109
-
110
-
111
-
112
-
113
-
114
-
115
-
116
-
117
-
118
-
119
-
120
-
121
-
122
-
123
-
124
-
125
-
126
-
127
-
128
-
129
-
130
-
131
-
132
 |
 |
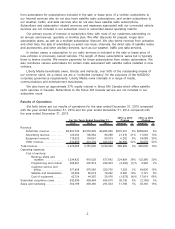
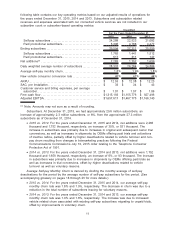
We expect subscriber revenues to increase based on the growth of our subscriber base,
including the increases in certain of our subscription rates and the sale of additional services to
subscribers.
Advertising Revenue includes the sale of advertising on certain non-music channels.
•2015 vs. 2014: For the years ended December 31, 2015 and 2014, advertising revenue was
$122,292 and $100,982, respectively, an increase of 21%, or $21,310. The increase was
primarily due to a greater number of advertising spots sold and transmitted as well as
increases in rates charged per spot.
•2014 vs. 2013: For the years ended December 31, 2014 and 2013, advertising revenue was
$100,982 and $89,288, respectively, an increase of 13%, or $11,694. The increase was
primarily due to a greater number of advertising spots sold and transmitted, as well as
increases in rates charged per spot.
We expect our advertising revenue to continue to grow as more advertisers are attracted to our
national platform and growing subscriber base and as we launch additional non-music channels.
Equipment Revenue includes revenue and royalties from the sale of satellite radios,
components and accessories.
•2015 vs. 2014: For the years ended December 31, 2015 and 2014, equipment revenue was
$110,923 and $104,661, respectively, an increase of 6%, or $6,262. The increase was driven
by royalties from higher OEM production and sales to distributors, partially offset by lower
direct to consumer sales.
•2014 vs. 2013: For the years ended December 31, 2014 and 2013, equipment revenue was
$104,661 and $80,573, respectively, an increase of 30%, or $24,088. The increase was
driven by higher sales to distributors and royalties from OEM production, partially offset by
lower per unit revenue on direct to consumer sales.
We expect equipment revenue to fluctuate based on OEM production for which we receive
royalty payments for our technology and, to a lesser extent, on the volume of equipment sales in
our aftermarket and direct to consumer business.
Other Revenue includes amounts earned from subscribers for the U.S. Music Royalty Fee,
revenue from our connected vehicle business and our Canadian affiliate and ancillary revenues.
•2015 vs. 2014: For the years ended December 31, 2015 and 2014, other revenue was
$512,050 and $421,150, respectively, an increase of 22%, or $90,900. The increase was
driven by revenues from the U.S. Music Royalty Fee as the number of subscribers subject to
the 13.9% rate increased along with an overall increase in subscribers, higher revenue
generated from our connected vehicle business, and increased revenue from our Canadian
affiliate.
•2014 vs. 2013: For the years ended December 31, 2014 and 2013, other revenue was
$421,150 and $344,574, respectively, an increase of 22%, or $76,576. The increase was
driven by revenues from the U.S. Music Royalty Fee as the number of subscribers subject to
the 12.5% rate increased along with an overall increase in subscribers, by a change in an
agreement with a rental car company and the inclusion of a full year of revenue generated
by our connected vehicle business.
We expect other revenue to increase as our growing subscriber base drives higher U.S. Music
Royalty Fees.
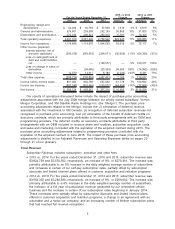
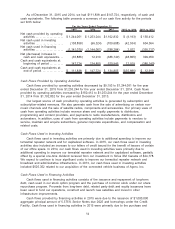
Operating Expenses
Revenue Share and Royalties include distribution and content provider revenue share, royalties
for transmitting content and web streaming, and advertising revenue share.
•2015 vs. 2014: For the years ended December 31, 2015 and 2014, revenue share and
royalties were $1,034,832 and $810,028, respectively, an increase of 28%, or $224,804, and
increased as a percentage of total revenue. The increase was primarily due to $128,256 in
expense recorded during the year ended December 31, 2015 related to our settlements
4